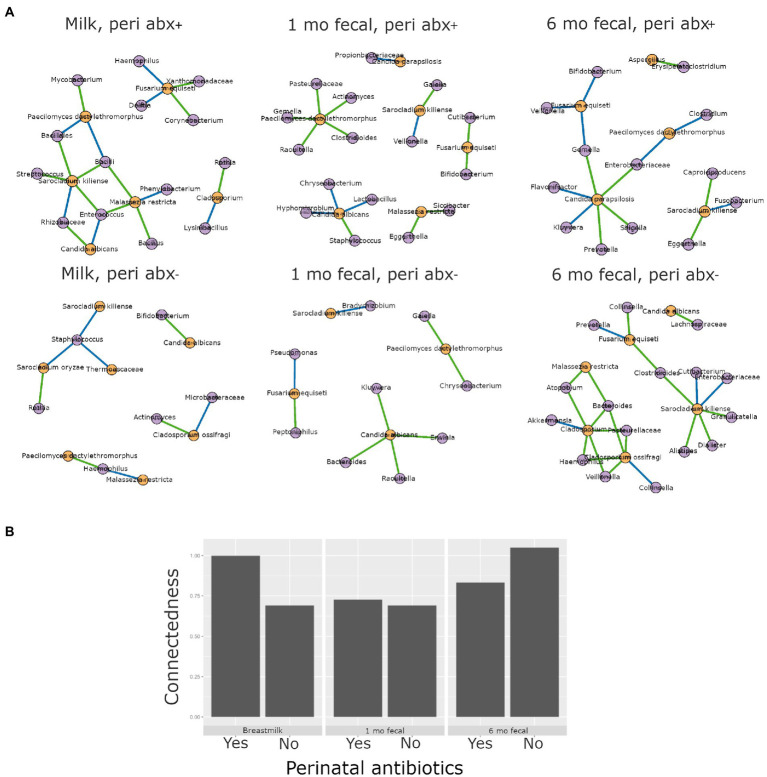
Figure 7.
Interkingdom relationship comparisons by perinatal antibiotic exposure. Panels in A are interkingdom network maps of significant interactions between bacterial (purple) and fungal (orange) taxa and are organized by sample type. Blue line, negative correlation; green line, positive correlation. Plot in B is of interkingdom connectedness values (see Methods) by sample type. Sample n’s included in network analyses for Perinatal antibiotic-exposed (peri abx +, top row): breastmilk 19, 1-month feces 26, 6-month feces 18 and for Perinatal antibiotics unexposed (peri abx -, bottom row): breastmilk 55, 1-month feces 72, 6-month feces 62.

