
Figure 2.
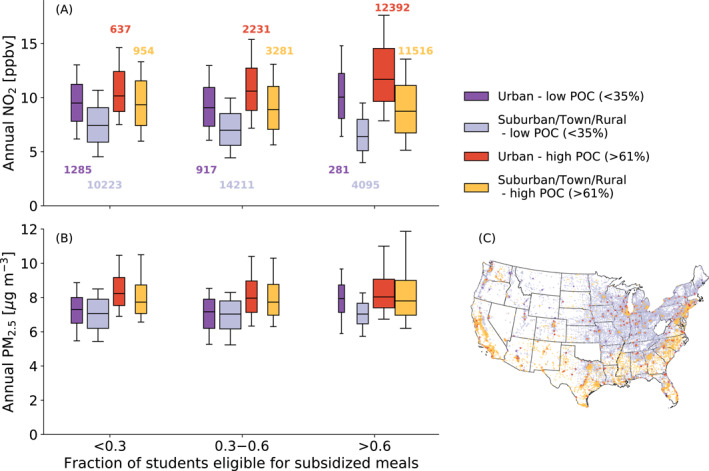
Boxplots of annually averaged (a) NO2 and (b) PM2.5 surface mixing ratios split into categories of poverty level, which is defined by the fraction of students eligible for free or reduced lunch. A greater fraction of free or reduced lunch indicates a higher level of poverty. Within each poverty‐level bin, separate boxplots are shown for schools in urban and combined suburban, town, and rural locations for low people of color (POC) schools (<35% POC students) and high POC schools (>61% POC students). The thresholds for high and low POC schools are based on the 60th and 40th percentile of the percentage of POC students in all public schools across the contiguous US. The width of each boxplot is scaled for visual aid to three size categories corresponding to the number of schools in each distribution, which are listed near each distribution in corresponding colors. (c) A map of schools that belong in each race and locale category.