
Figure 3.
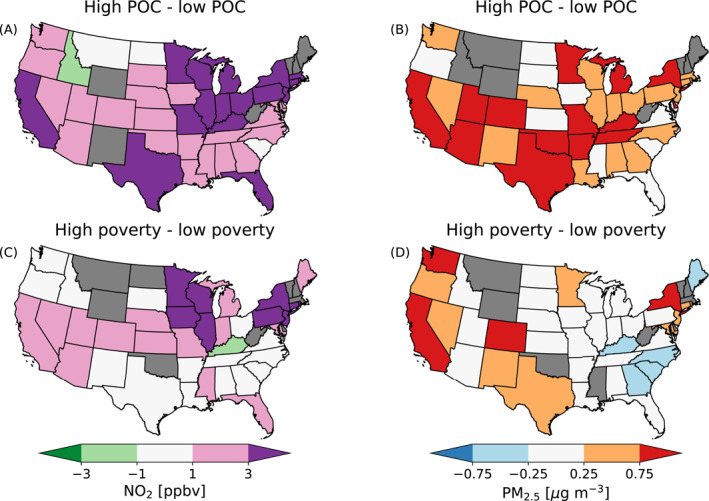
Difference in mean (a) NO2 and (b) PM2.5 between high people of color (POC) schools (>61% POC students based on the 60th percentile nationwide) and low POC schools (<35% POC students based on the 40th percentile nationwide). Difference in mean (c) NO2 and (d) PM2.5 between high‐poverty (greater than 75% students eligible for free or reduced lunch) and low‐poverty schools (fewer than 25% students eligible for free or reduced lunch). The colors are gray if there is no data for that state, there are fewer than 10 schools in either poverty or racial/ethnic categories, or if the difference was not found to be statistically significant using an independent t‐test (Yuen, 1974).