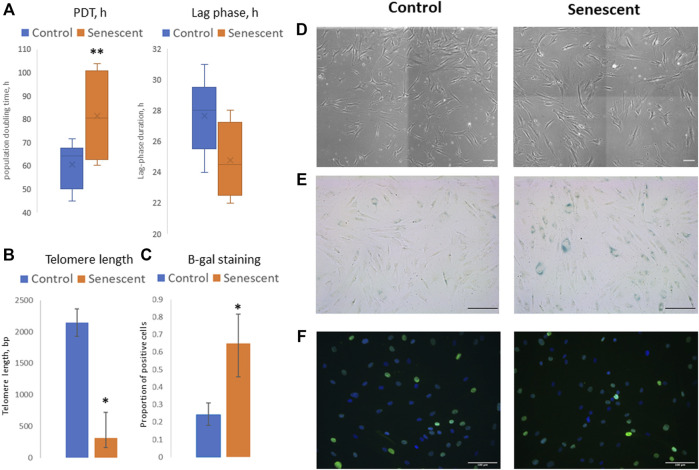
FIGURE 1.
Senescent biomarkers in MSCs isolated from young and aged donors. (А)—population doubling time (PDT, hours) and lag phase duration (hours) measured in Incucyte ZOOM system; (B)—telomere length (bp); (C)—proportion of cells with positive staining for beta-galactosidase (b-gal); (D–F)–representative microphotographs of MSCs isolated from young and aged donors: (D)—cell morphology in culture, phase-contrast images; (E)—b-gal staining, scale bar = 100 μm; (F)—immunocytochemical staining for p21 expression (green), nuclei are stained with DAPI). Control–MSCs isolated from young donors, senescent–MSCs isolated from aged donors. Mean ± SE, *p < 0.05, **p = 0.057.

