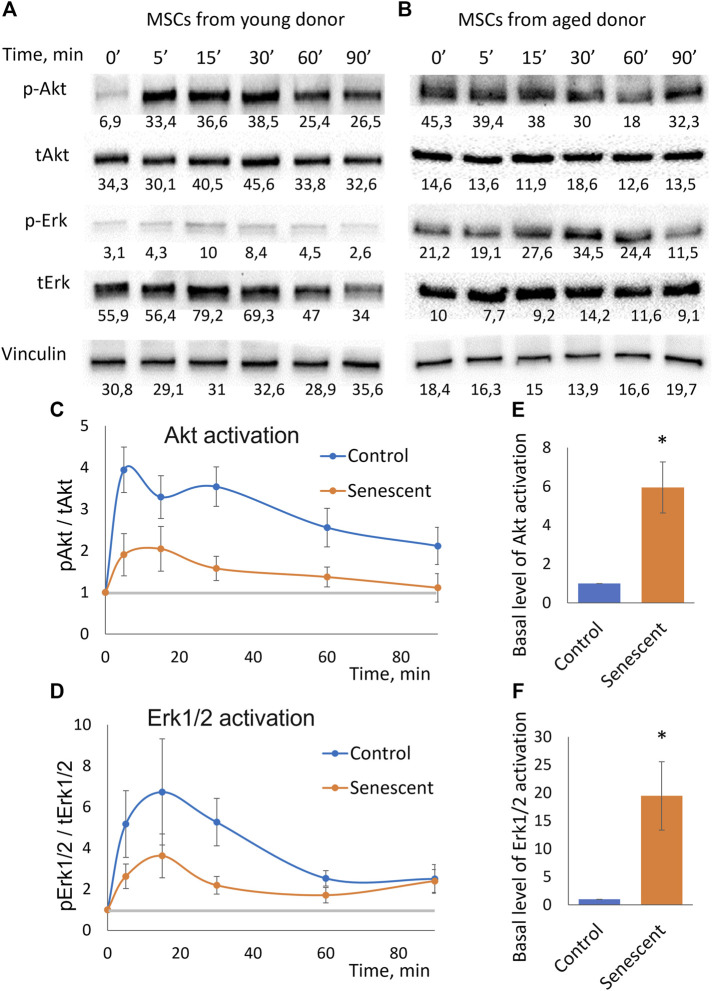
FIGURE 3.
Insulin-dependent signaling in control and senescent MSCs. (A,B). Representative results of Western-blot analysis of Akt (Thr308) and Erk1/2 phosphorylation under the action of insulin in different time points in control (A) and senescent (B) MSCs. The results of densitometric analysis marked under the protein bands; (C). Time dynamics of Akt (Thr308) phosphorylation in control and senescent MSCs under insulin stimulation, n = 6 Y-axis represent ratio in Western-blot band volume between p-Akt (T308) and total Akt; (D). Time dynamics of Erk1/2 (Thr202/Tyr204) phosphorylation in control and senescent cells under insulin stimulation, n = 6 Y-axis represent ratio in Western-blot band volume between p-Erk1/2 (Thr202/Tyr204) and total Erk; (E,F). Basal level of Akt (E) and Erk1/2 (F) phosphorylation in control and senescent cells, n = 4–5. Mean ± SE, *p < 0.05.

