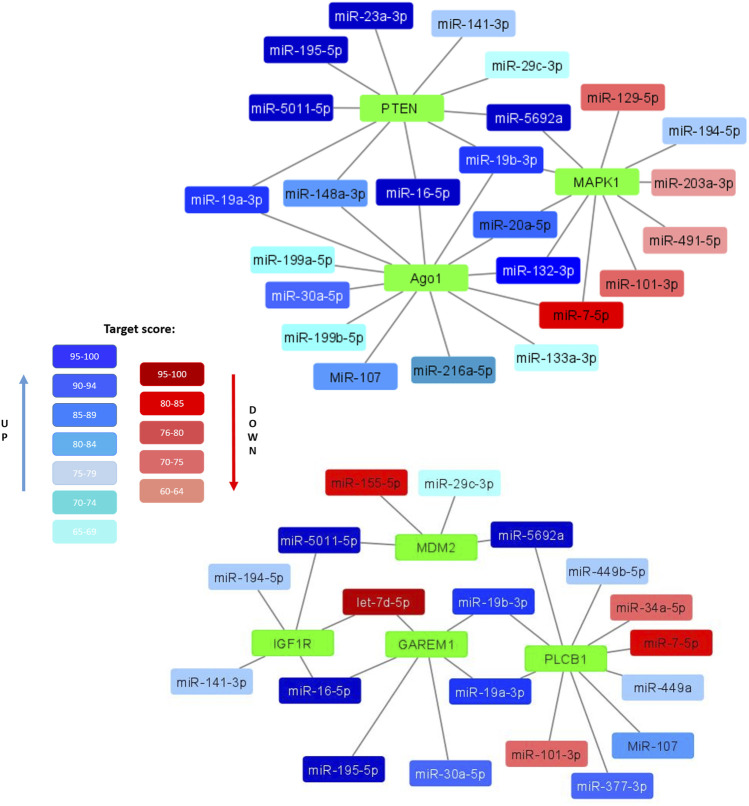
FIGURE 4.
Selected miRNAs differentially expressed in EVs secreted by control and senescent MSCs along with their targets. Interaction maps illustrated differently expressed miRNAs as edges and their potential target mRNA as nodes. Coloured miRNAs are shown if significantly reduced (red) or enhanced (blue) in MSC-EVs from aged donors compared to young ones. The degree of color saturation shows the value of the target score level (relative units). A more saturated color indicates a higher value, and therefore a high reliability of the relationship between the miRNA and its target.

