FIGURE 5.
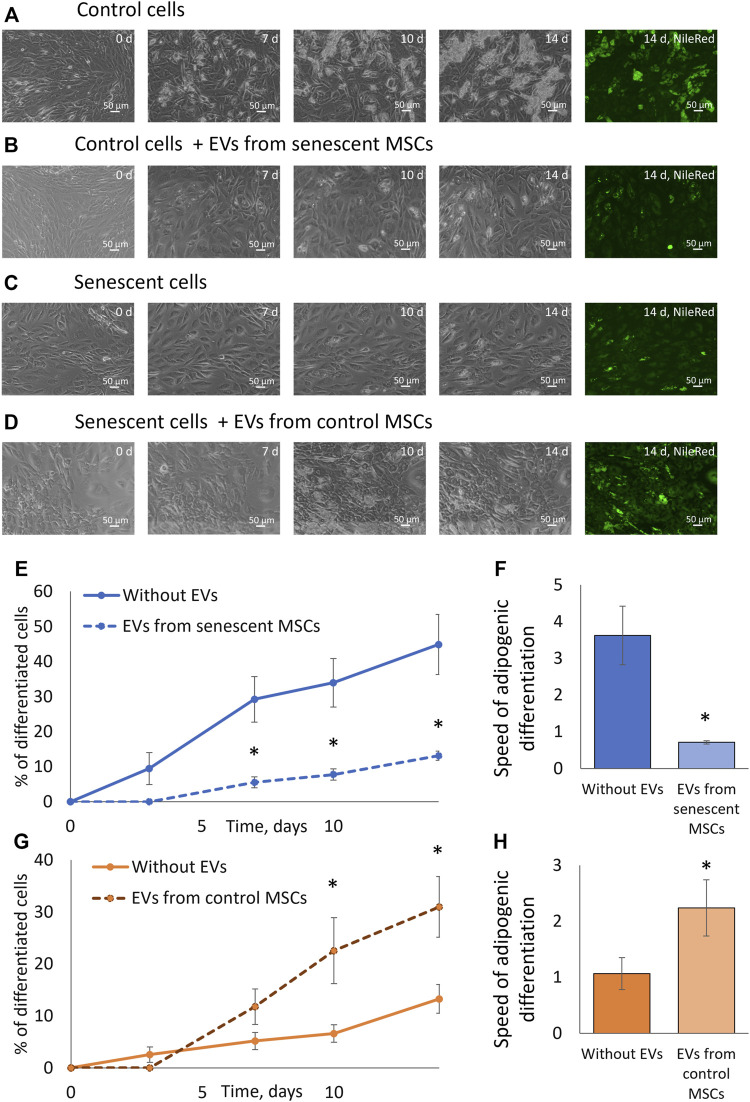
Extracellular vesicles affect the adipogenic potential of MSCs. (A). Phase-contrast images of the dynamics of differentiation of control cells for 14 days with staining with neutral lipid dye NileRed on the 14th day; (B). Phase-contrast images of the dynamics of differentiation of control cells with stimulation by EVs from senescent cells for 14 days with staining with neutral lipid dye NileRed on the 14th day; (С). Phase-contrast images of the dynamics of differentiation of senescent cells for 14 days with staining with neutral lipid dye NileRed on the 14th day; (D). Phase-contrast images of the dynamics of differentiation of senescent cells with stimulation by EVs from control cells for 14 days with staining with neutral lipid dye NileRed on the 14th day; (E). Dynamics of increase in the number of cells accumulating fat drops during adipogenic differentiation of control MSCs in the presence of EVs from senescent cells and without, n = 7; (F). The tangent of the slope of the increase in the number of differentiating control cells (differentiation rate) in the presence of EVs from senescent cells and without EVs, n = 7–11; (G). Dynamics of increase in the number of cells accumulating fat drops during adipogenic differentiation of senescent MSCs in the presence of EVs from control cells and without EVs, n = 6; (H). The tangent of the slope of the increase in the number of differentiating senescent cells (differentiation rate) in the presence of EVs from control cells and without, n = 5–9. Mean ± SE, *p < 0.05, **p < 0 01.

