Fig. 1.

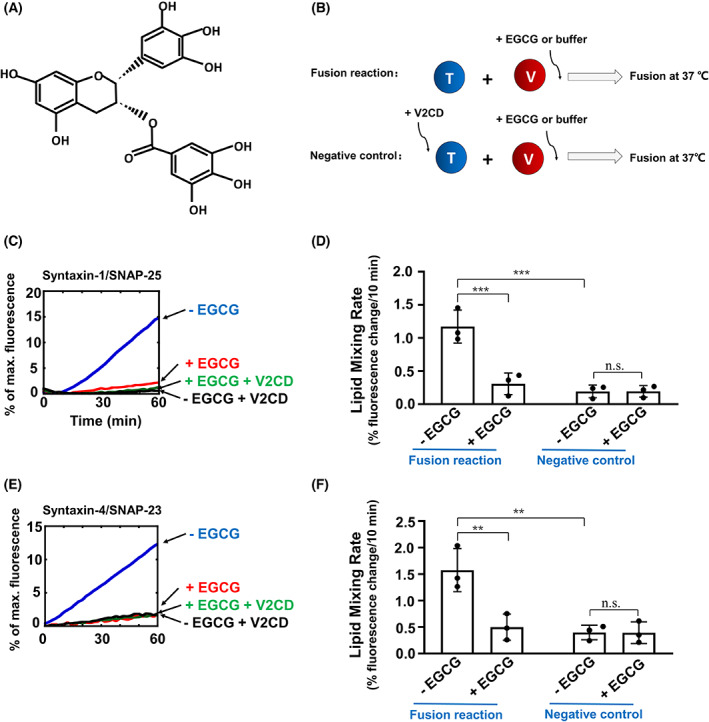
EGCG inhibits insulin secretory SNARE‐mediated lipid mixing reaction. (A) Chemical structure of EGCG. (B) Illustrations of the liposome fusion procedures. The t‐SNARE liposomes were reconstituted with syntaxin‐1/SNAP‐25, whereas the v‐SNARE liposomes contained VAMP2. (C) Fusion of the reconstituted proteoliposomes in the absence or presence of 10 μm EGCG. Negative controls: 20 μm V2CD was added at the beginning of the reactions. Each fusion reaction contained 5 μm t‐SNAREs and 1.5 μm v‐SNARE. The fusion reactions were measured using a FRET‐based lipid mixing assay. (D) Initial lipid mixing rates of the liposome fusion reactions shown in (C). Data are presented as a percentage of fluorescence change per 10 min. Error bars indicate the SD. Data are presented as the mean ± SD (n = 3 independent replicates). P values were calculated using two‐way ANOVA with Tukey's multiple comparisons test. n.s., P > 0.05; ***P < 0.001. (E) Fusion of the reconstituted proteoliposomes in the absence or presence of 10 μm EGCG. The t‐SNARE liposomes were reconstituted with syntaxin‐4 and SNAP‐23, whereas the v‐SNARE liposomes were prepared using VAMP2. Negative controls: 20 μm V2CD was added at the beginning of the reactions. Each fusion reaction contained 5 μm t‐SNAREs and 1.5 μm v‐SNARE. The fusion reactions were measured using a FRET‐based lipid mixing assay. (F) Initial lipid mixing rates of the liposome fusion reactions shown in (E). Data are presented as a percentage of fluorescence change per 10 min. Error bars indicate the SD. Data are presented as the mean ± SD (n = 3 independent replicates). P values were calculated using two‐way ANOVA with Tukey's multiple comparisons test. n.s., P > 0.05; **P < 0.01.
