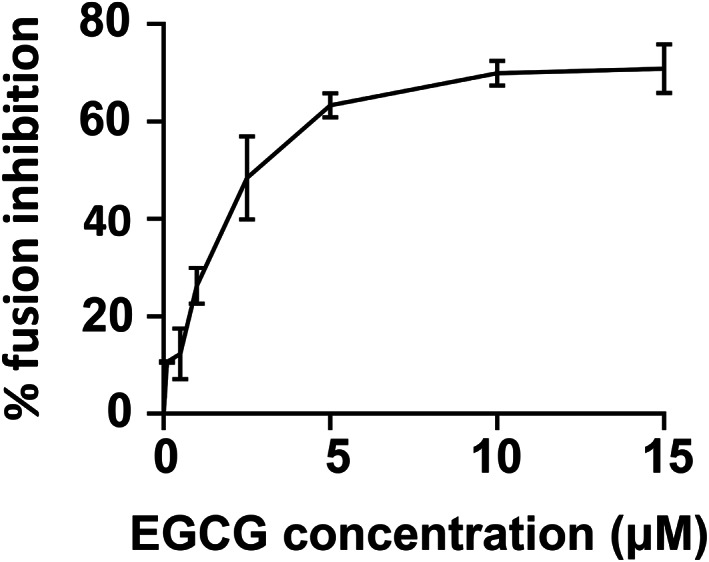
Fig. 3.

Dose dependence of EGCG activity in the SNARE‐dependent fusion reaction. EGCG was added to the reconstituted fusion reaction at the indicated concentrations. Each fusion reaction contained 5 μm t‐SNAREs and 1.5 μm v‐SNARE. Data are presented as a percentage of fusion inhibition at indicated concentration of EGCG. Error bars indicate the SD. Data are presented as the mean ± SD (n = 3 independent replicates).
