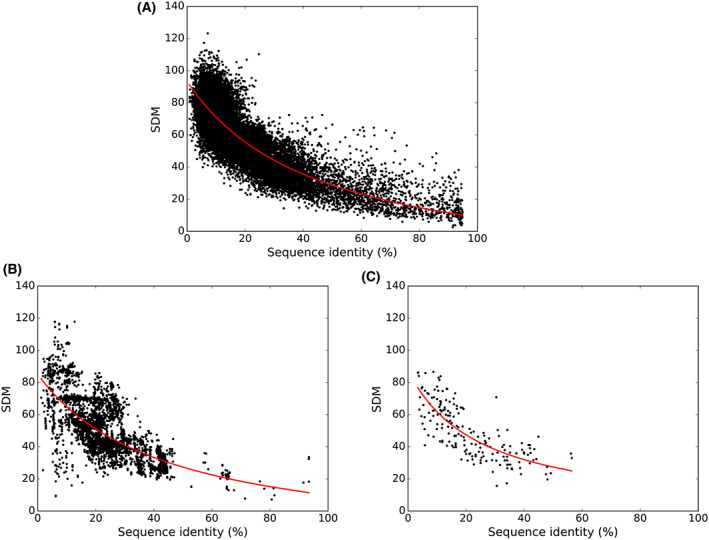
Fig. 1.

Relationship between sequence similarity and structural deviation. Scatter plot with sequence identity along X‐axis and SDM score along Y‐axis. (A) Representing non‐interacting homologous pairs of monomeric proteins, (B) Scatter plot of interacting homologous subunits of heterodimers and (C) Scatter plot of interacting homologous domains of two‐domain repeats. The best fit line in red color shows the trend of the distribution.
