FIGURE 2.

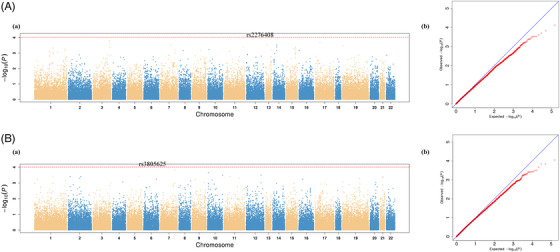
Manhattan and quantile–quantile plots of the association with bleeding events of patients treated with dabigatran. (A) UBASH3B SNP rs2276408. (B) FBN2 SNP rs3805625. Annotation: (a) Manhattan plot; (b) Quantile–quantile plot

Manhattan and quantile–quantile plots of the association with bleeding events of patients treated with dabigatran. (A) UBASH3B SNP rs2276408. (B) FBN2 SNP rs3805625. Annotation: (a) Manhattan plot; (b) Quantile–quantile plot