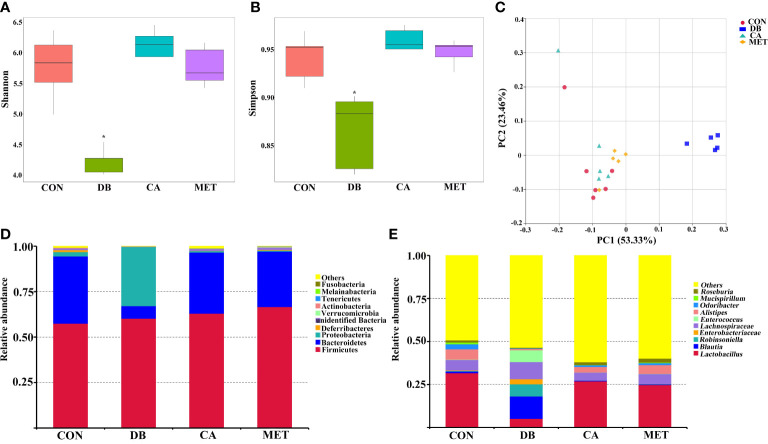
Figure 5.
Effects of chlorogenic acid on cecal microbe composition in diabetic db/db mice. (A) Shannon index; (B) Simpson index; (C) PCoA plot of the microbiota based on an unweighted UniFrac metric; (D) Relative abundance of predominant bacteria at the phylum level; (E) Relative abundance of predominant bacteria at the genus level. *P < 0.05 (significant difference between mice in the DB group and mice in the other groups).

