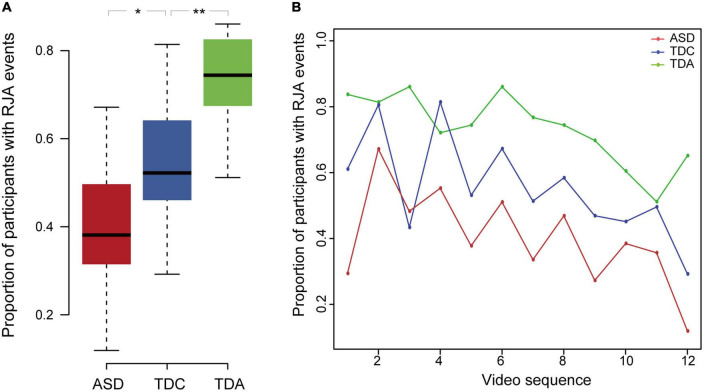
FIGURE 2.
The proportion of participants with RJA events differed among three groups. (A) The proportion of participants having RJA events in the three groups for the 12 clips. Error bars represented standard error from the mean. **Indicates significant differences (p < 0.01), *indicates significant differences (p < 0.05). (B) Proportion of RJA events observed in the ASD, TDC, and TDA groups during all 12 video clips. In all three groups, proportion of participants with RJA events was lower for video clips shown late in the sequence than for clips shown early in the sequence.

