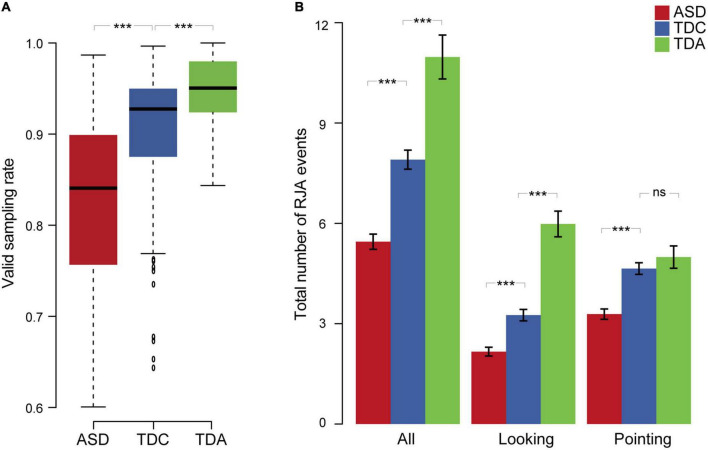
FIGURE 3.
Eye tracking behaviors and RJA events among three groups. (A) The valid sampling rate of the three groups for 12 clips. (B) Total number of RJA events observed in the three groups for 12 clips. Data are presented as mean ± SEM. Error bars represent standard error from the mean. ***Indicates significant differences (p < 0.001), “ns” indicates a non-significant difference.

