FIGURE 5.

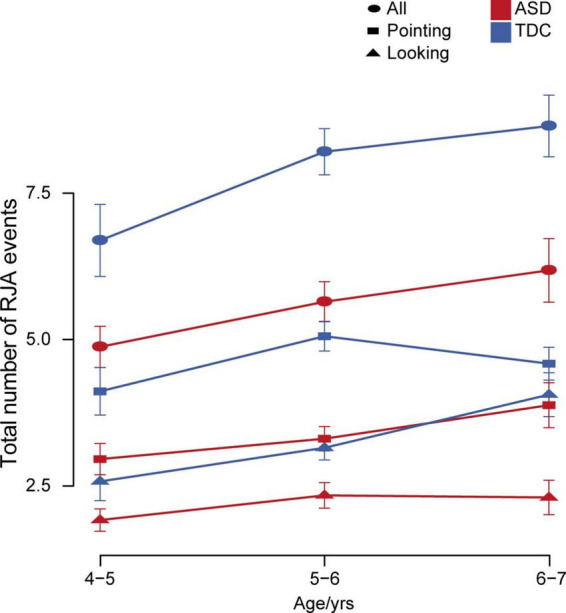
Changes in total number of RJA events with age in the ASD and TDC groups. Error bars represent standard error from the mean.

Changes in total number of RJA events with age in the ASD and TDC groups. Error bars represent standard error from the mean.