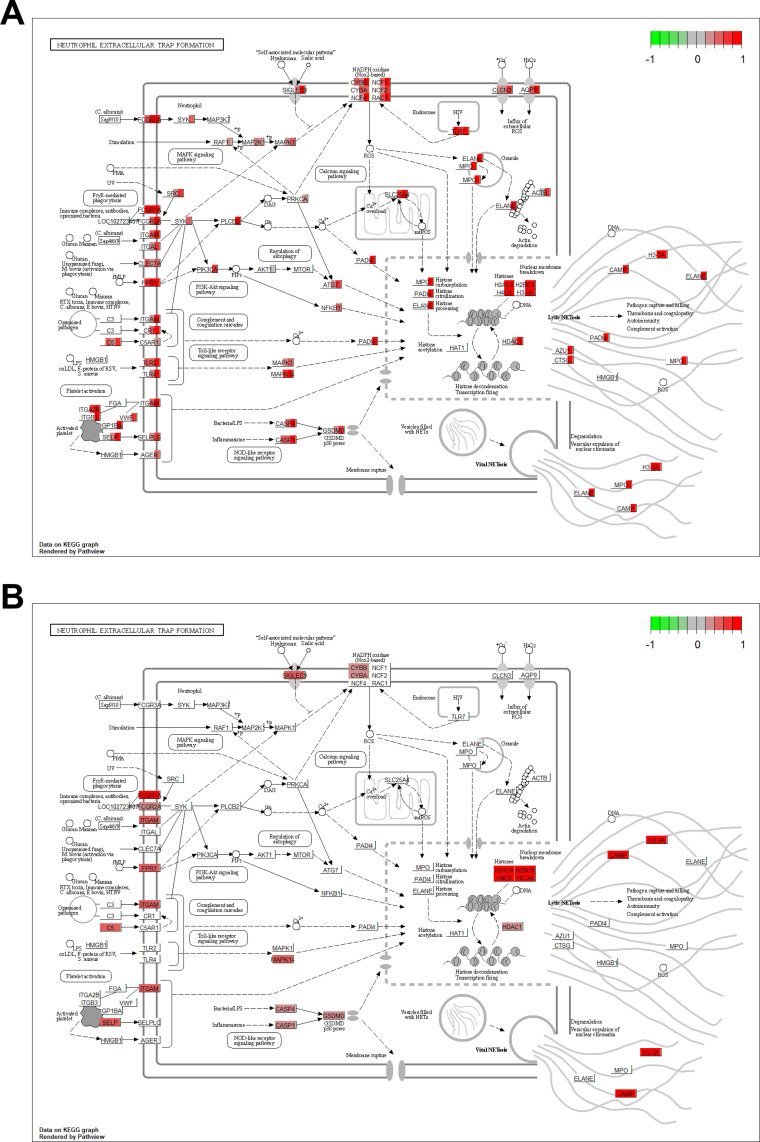
Fig 3. KEGG NET formation pathway illustrating the fold changes (log2) for significantly upregulated genes at different time points.
A) Gene expression as fold-change is indicated by a color block in the background rectangle or each gene corresponding to the contrasts, 13–18, 7–12, 1–6 months before diagnosis and TB compared to their respective controls (from left to right). B) As above but illustrating the significantly increased expression of genes in TB patients with high PET-scores compared to those with low PET-scores. Figures rendered by the R Bioconductor pathview package [29], on finite resolution raster images from KEGG.

