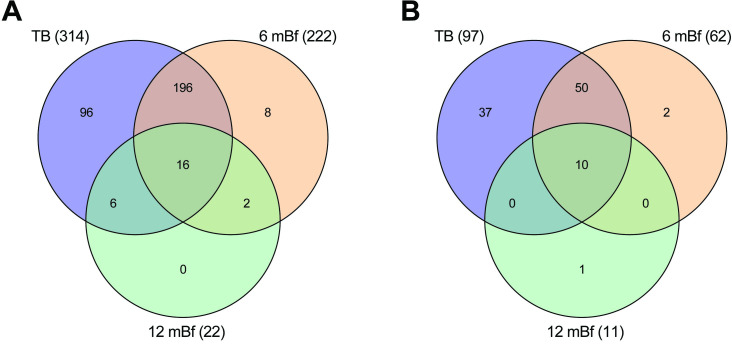
Fig 5.
Venn diagram of the overlap in significantly upregulated genes that are annotated to function in: A) neutrophil degranulation, and B) NET formation. Differentially expressed genes at 7–12 and 1–6 months before diagnosis and in TB patients in contrast to the non-TB time zero baseline group from the GC6-74 study. The numbers in parenthesis indicate the total numbers of upregulated genes at the time point.

