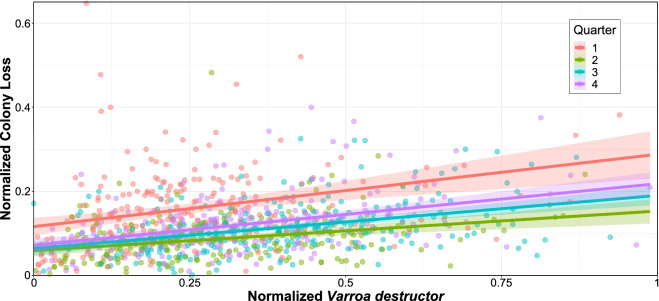
Figure 4.
Scatter plot of normalized honey bee (Apis mellifera) colony loss (number of lost colonies over the maximum number of colonies) against normalized Varroa destructor presence (number of colonies affected by V. destructor over the maximum number of colonies) for each state and each quarter of 2015–2021 (the first quarter being January-March). Points are color-coded by quarter, and ordinary least squares fits (with corresponding standard error bands based on a 0.95 confidence level) computed by quarter are superimposed to visualize the positive association.

