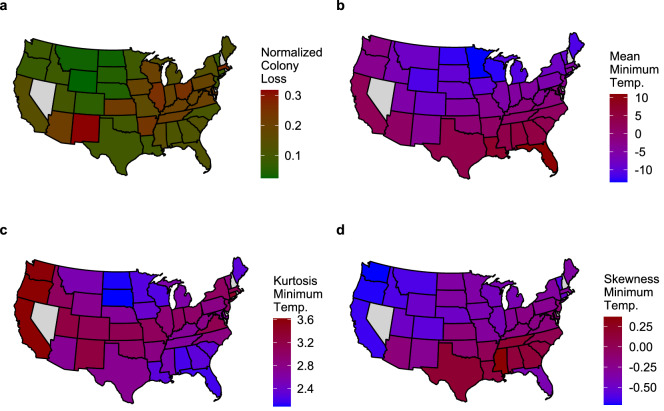
Figure 5.
Spatial representation (by state) of median values for four different indices regarding colony loss and minimum temperature in the first quarter (January-March) of seven consecutive years (2015–2021) for each state. (a) Normalized honey bee (Apis mellifera) colony loss. (b) Mean of minimum temperatures. (c) Kurtosis of minimum temperatures (how “extreme” the minimum temperatures were). (d) Skewness of minimum temperatures (whether they tended to concentrate in their lower or upper range). In each panel, the color attributed to a state represents the median of seven index values (first quarter of seven years). North Dakota shows a relatively low normalized colony loss (panel (a)), one of the lowest mean minimum temperature (panel (b)), and one of the lowest minimum temperature kurtosis (panel (c)). This suggests that consistently low minimum temperatures during the first quarter (low mean and low kurtosis) may be associated with lower colony loss in that state. The map has been generated by the authors in R 3.6.249.

