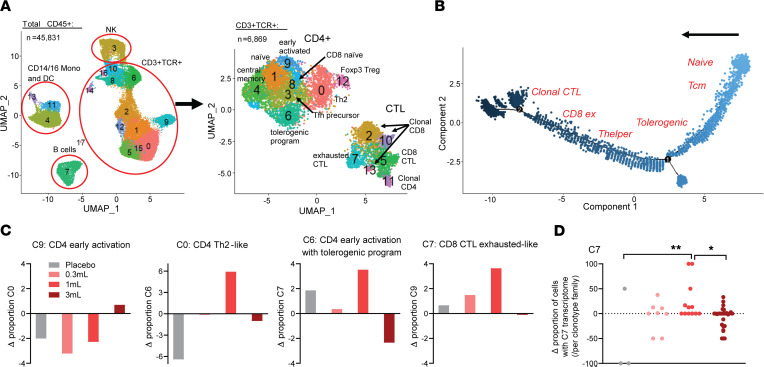
Figure 5. Single-cell TCR/RNA-Seq demonstrates expanded CD4 tolerogenic program and CD8 exhaustion of persistent clonotypes 28 days after 1 mL DEN-181.
(A) Uniform manifold approximation and projection (UMAP) of all 45,831 CD45+ cells from PBMCs from all patients at day 1 and day 29 pooled together, with supercluster annotations assigned by canonical marker gene expression. The CD3+TCR+ supercluster was reclustered, resulting in the UMAP comprising 6,869 cells on the right, which was manually annotated (Methods, Supplemental Figure 7). (B) Pseudotime trajectory analysis using Monocle 2. Manual annotation depicts the approximate position of enrichment of each Seurat cluster on the trajectory. (C) The change in specified CD3+TCR+ subclusters at day 29 relative to day 1 for the placebo, 0.3 mL, 1 mL, and 3 mL dose groups (n = 4). (D) The change in proportion of persistent clonotypes with C7 transcriptome at day 29 relative to day 1 (n = 3–19 C7 clonotypes; 1-way ANOVA with Holm-Šídák multiple comparisons test, *P < 0.05, **P < 0.01).

