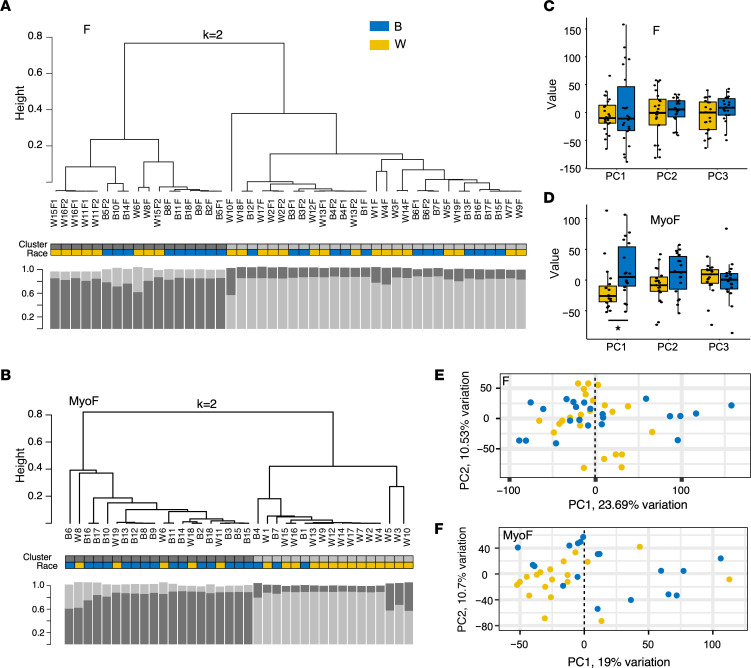
Figure 1. Race-based clustering of RNA-Seq results from myometrial and fibroid samples.
(A and B) Whereas unsupervised hierarchical k = 2 means clustering of RNA-Seq results from MED12mt fibroid samples (n = 24 F White and n = 22 F Black) is not significantly associated with race (Fisher’s exact test, P = 0.76) (A), the results from myometrial samples (n = 19 MyoF White and n = 18 MyoF Black) show an association with race (Fisher’s exact test, P = 8.3 × 10⁻⁴) (B). The length of each leaf in the dendrograms indicates degree of dissimilarity. Race of each sample is color coded as indicated. The clusters are shown above the race. Spearman bootstrap analyses (1,000×) are shown below each dendrogram for each sample. The y axis of bootstrap columns indicates stability of clustering. (C and D) Box plots of the first 3 principal components (PC) of RNA-Seq results from Black and White F (C) and MyoF (D). The value of each sample represents the individual gene expression values transformed by the rotation matrix estimated from the PCA. Only PC1 in MyoF are significantly different (likelihood ratio test, *P = 0.03). (E and F) PC plot analyses for PC1 versus PC2 of F (E) and MyoF (F) shows samples from White and Black women in 2-dimensional space. Each dot represents 1 sample.

