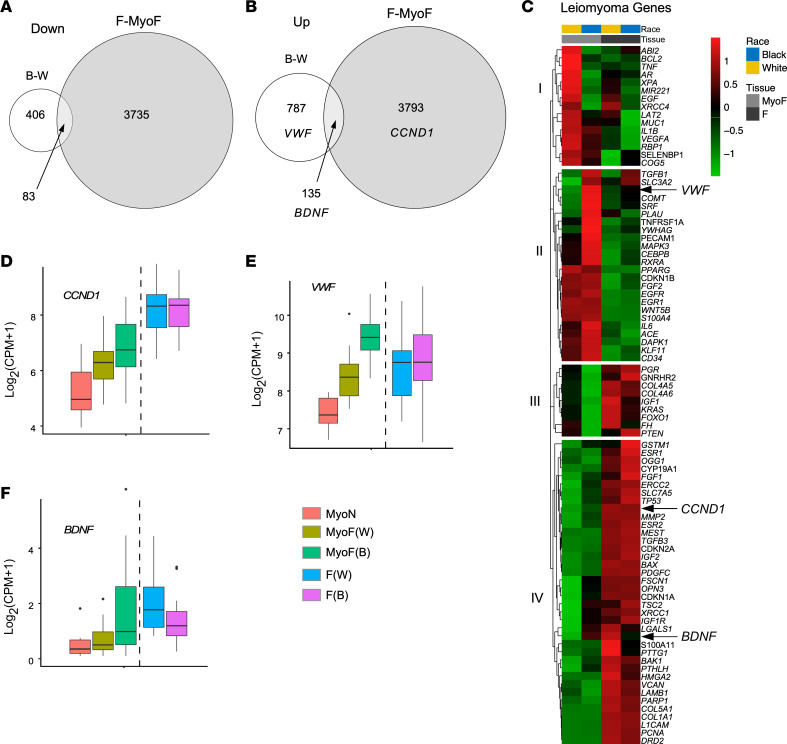
Figure 3. Transcriptomic similarities in fibroids (F) from all women and Black women’s matched myometria (MyoF).
(A and B) Venn diagrams illustrate the overlapping downregulated (A) and upregulated (B) differentially expressed genes (DEGs) between MyoF from Black women (n = 18) and MyoF from White women (n = 19) and between F (Black and White combined, n = 46) and MyoF (Black and White combined, n = 37). Hypergeometric testing revealed that the overlaps were significant, with P = 9.0 × 10⁻⁵ for the downregulated genes and P = 1.9 × 10⁻¹⁴ for the upregulated genes. (C) Heatmap of the leiomyoma gene set from Disease Ontology with added BDNF, using the average log2(CPM + 1) of each group: MyoF White, MyoF Black, F White (each n = 24), and F Black (n = 22). Color gradient represents gene expression levels as Z scores. (D–F) Box plot of CCND1 (D), VWF (E), and BDNF (F) of myometrium from White nonfibroid women (MyoN) (n = 6), MyoF from White (n = 19), or Black (n = 18) women and F from White (n = 24) or Black (n = 22) women. Gene expression is shown as log2(CPM + 1). FDR P values for each comparison are reported in the Table 1.

