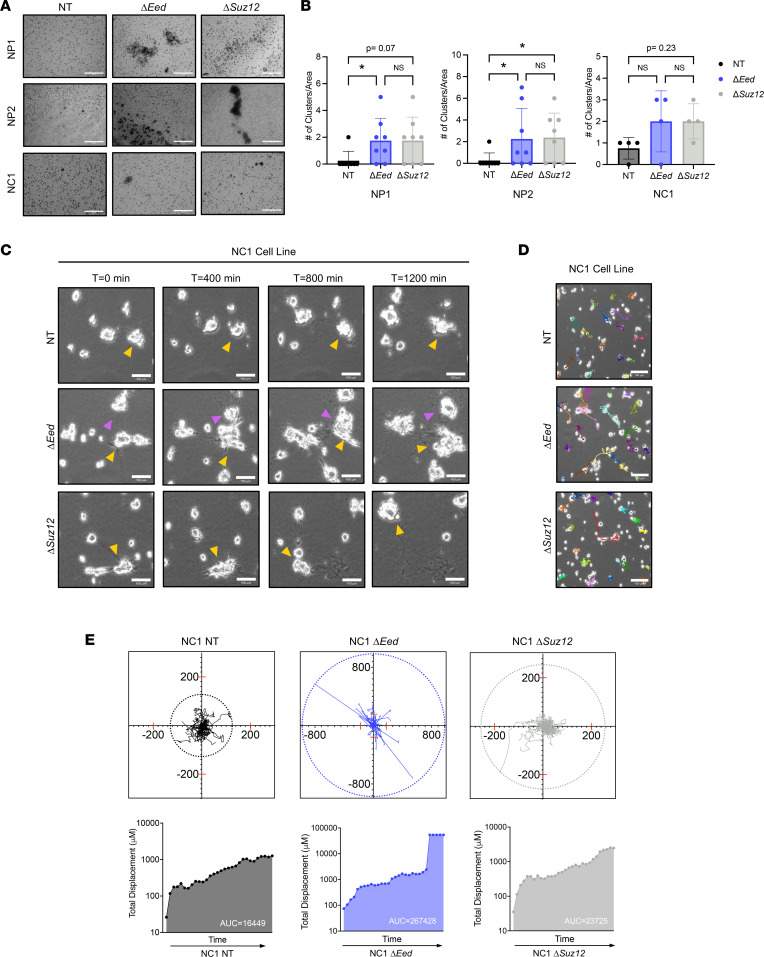
Figure 2. PRC2 deletion alters interaction with collagen matrix.
(A) Representative images (original magnification, 20×) of NP1, NP2, and NC1 cell panels showing clustering phenotype observed after Transwell invasion (n = 4). (B) Quantification of cell clusters from Transwell invasion assays showing increased number of clusters with PRC2 loss. Total number of clusters was analyzed by Kruskal-Wallis with multiple comparisons. (Area = 0.546 mm2) (n = 4). (C) Phase-contrast movies of NC1 cells plated on collagen for 18 hours before capturing cell dynamics via 5-minute increment frames for 20 hours (1,200 minutes; original magnification, 10×). Yellow and pink arrows denote key cell motility features of the same cell across multiple frames. Little movement is seen in the NT cells, while the formation of cell clusters (ΔEed frames) and rapid movement (ΔSuz12 frames) are observed with PRC2 loss (n = 3). (D) Representative images of movies (original magnification, 10×) with cell motility tracks highlighted. (E) Cell motility tracks (n = 25) plotted on an x/y coordinate graph illustrate total displacement by color ring of NT (left), ΔEed (middle), and ΔSuz12 (right). Quantification of total displacement over time is calculated with total displacement (μM) using area under the curve analysis. Scale bars at 200 μm. Data represent individual clusters with the mean ± SD; *P < 0.05.

