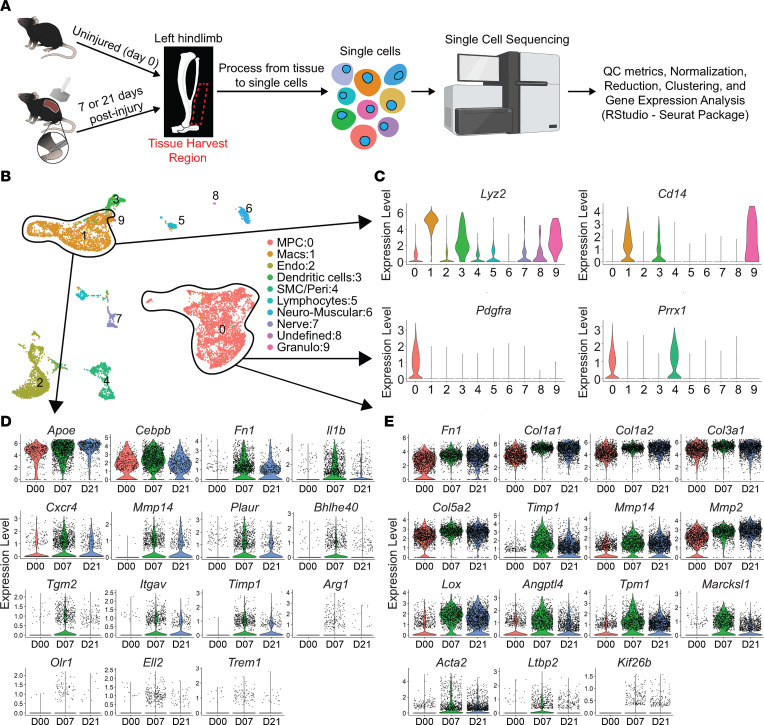
Figure 3. Single-cell sequencing showing change in genes regulated by TGF-β signaling.
(A) Overview of tissue to obtain results from scRNA-Seq. (B) Uniform manifold approximation and projection (UMAP) plot with all time points clustered and legend to the right of the plot. The MPC and macrophage (Mac) clusters are circled. Endo, endothelial; SMC/peri, smooth muscle cell/pericyte; Granulo, granulocyte. (C) Violin plots of genes marking MPCs and Macs. (D) Genes regulated by TGF-β in Macs from day 0 (uninjured), day 7, and day 21. (E) Genes regulated by TGF-β in MPCs from day 0 (uninjured), day 7, and day 21.

