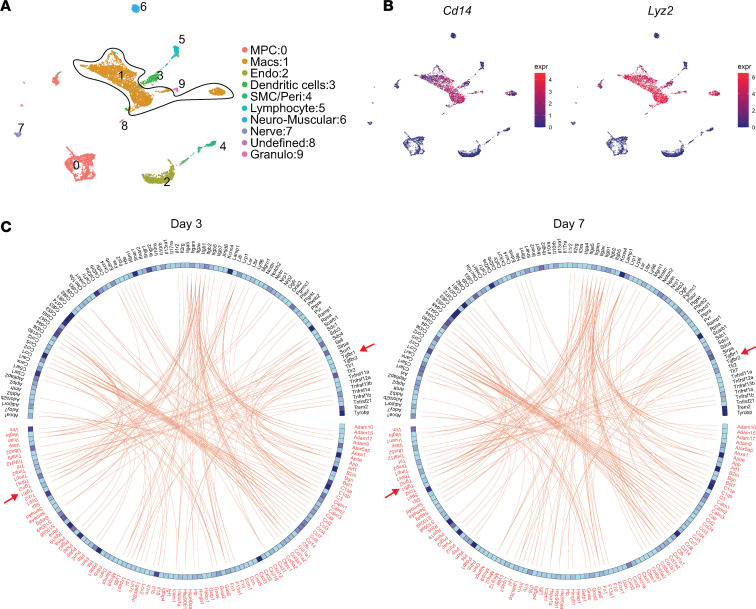
Figure 5. Ligand-receptor signaling in Macs.
(A) UMAP plot of cells from day 0 and day 3 clustered with legend to the right of the plot. The composite Mac clusters are circled. (B) UMAP plots of genes marking Macs. (C) A list of ligand-receptor pairs was obtained from literature. The panel shows the top 100 expressed ligand-receptor pairs (red-black respectively), extracted from the Mac clusters at day 3 and day 7. Red arrows point to TGF-β1 signaling.

