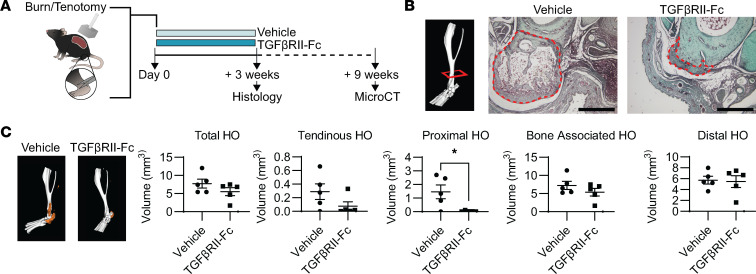
Figure 7. Effects of ligand trap (TGF-βRII-Fc) treatment on HO formation.
(A) Graphic to depict model and experiment. To the right is graphic depicting HO formation by MicroCT and the regions assessed and what those include. (B) Example MicroCT image with red box indicating the approximate level histologic sections were taken from. Safranin O stains of vehicle- and ligand trap–treated hind limbs (n = 2/group). Region of HO is outlined in red. Scale bars represent 500 μm. (C) MicroCT reconstructions of representative samples where the HO is indicated in orange. Graphs of HO volume quantification with proximal HO showing significance by Student’s t test (n = 5/group). Error bars represent mean ± SEM for parametric data.

