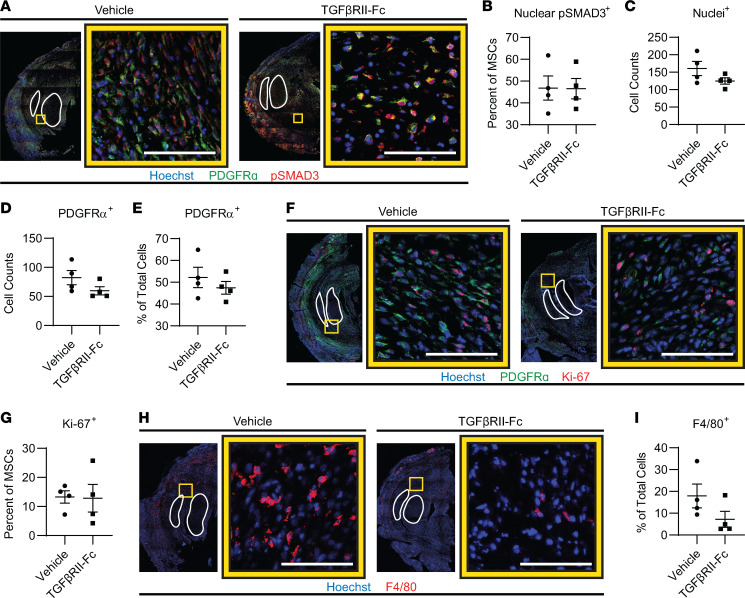
Figure 8. Ligand trap does not change in MSC canonical signaling or proliferation but trends toward decreased Macs.
(A) IF tile scans of the distal hind limb where the tendons are outlined in white. The yellow box indicates the zoomed-in image location to the right of the tile scan where the 2 groups are identified above the images and the color legend is below. (B) Canonical TGF-β signaling by p-SMAD3 nuclear percentage in PDGFRα+ (MPCs) cells (n = 4/group, 3 images/n). (C–E) Further quantification from A, of the nuclei at injury site, total MPCs, and percentage of MPCs from total. (F) IF images and (G) quantification of proliferation by anti–Ki-67 in MPCs (n = 4/group, 3 images/n). (H) IF images and (I) quantification of percentage of Macs by anti-F4/80 (n = 4/group, 2–3 images/n). Error bars presented in graphs represent mean ± SEM for parametric data and represent median ± interquartile range for nonparametric data. Scale bars represent 100 μm.

