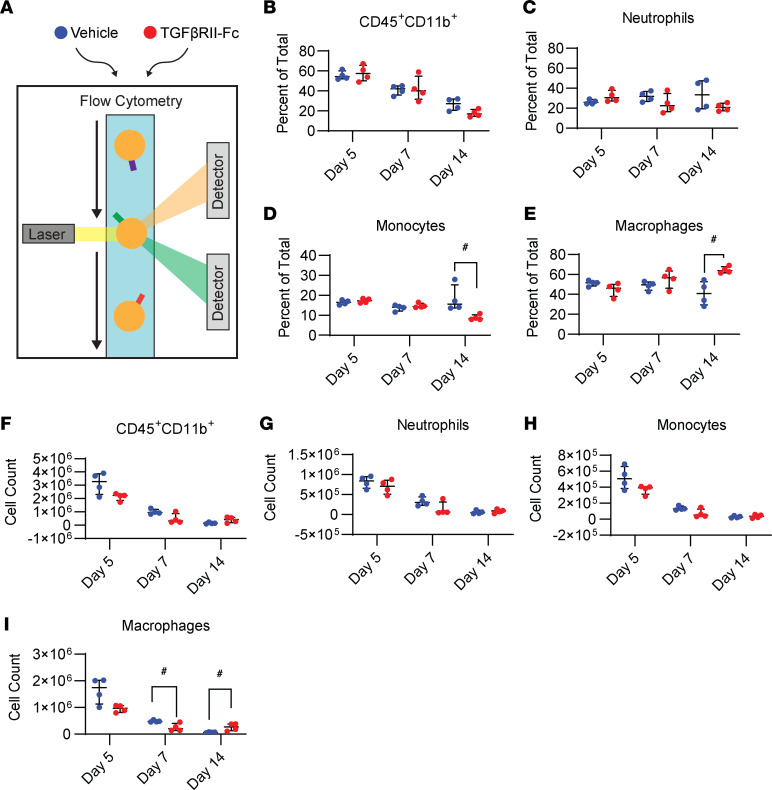
Figure 9. Flow cytometry shows treatment alters monocyte/Macs at damaged left hind limb tissue.
(A) Graphical depiction of cell groups undergoing flow cytometry (3 time points, n = 4/group). (B–E) The percentage of total cells for CD45+CD11b+, neutrophils, monocytes, and Macs. (F–I) The total cell counts. Error bars presented in graphs represent median ± interquartile range for nonparametric data. #P < 0.05 (the data were nonparametric, as explained in the Methods section).

