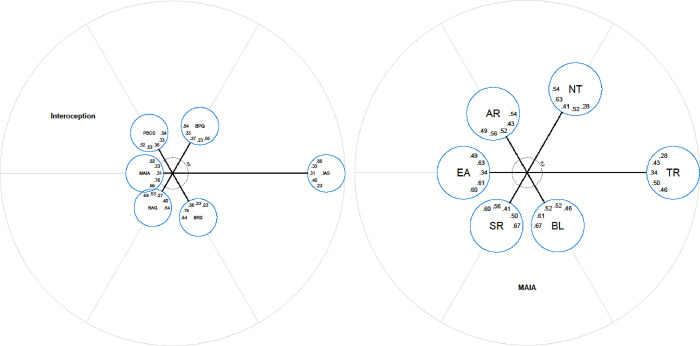
Fig 2.
Radar charts with scale locations of all interoceptive sensibility measures (left) including a zoomed chart of the centre, and MAIA-2 subscales in isolation (right). Numbers within the circles represent latent correlations between the respective scale with all the other scales. Correlations are arranged clockwise using the same order as the scales. AR = Attention Regulation, NT = Noticing, TR = Trusting, BL = Body Listening, SR = Self-Regulation, EA = Emotional Awareness.

