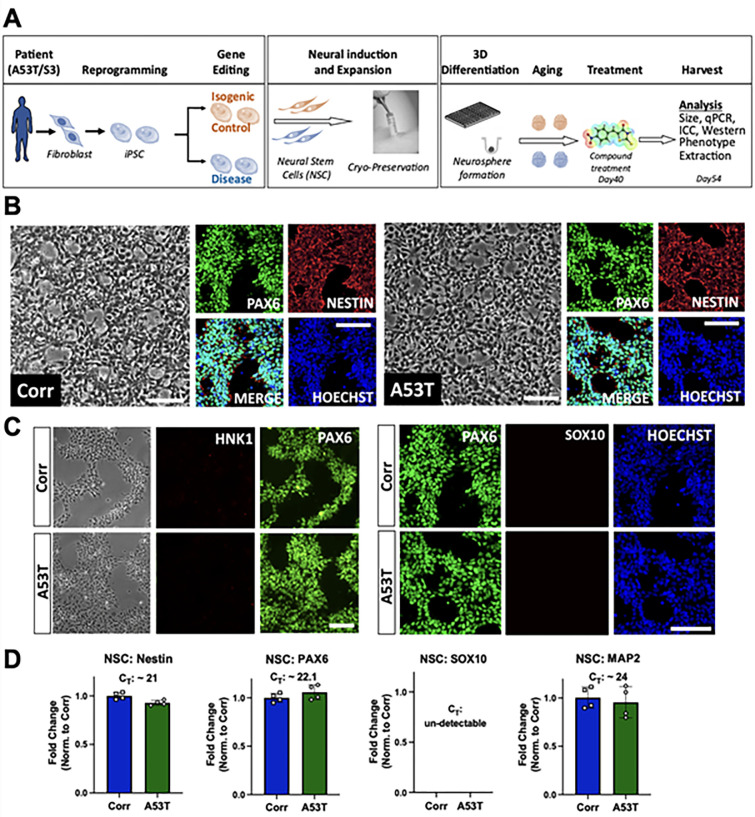
Fig 1. Process flow and quality control of Neural Stem Cells (NSC).
A) Process flow of patient-derived neurosphere generation. B) Representative phase contrast images and immunocytochemistry (ICC) for Hoechst and NSC markers (Nestin and PAX6). Left Panel: Isogenic control line (Corr). Right panel: A53T line. Scale bar: 100 μm. C) ICC for Hoechst, PAX6, and neural crest cell markers (HNK1 and SOX10). Top panels: Isogenic control line (Corr). Bottom panels: A53T line. Scale bar: 100 μm D) Gene expression mRNA levels of Nestin, PAX6, SOX10 and MAP2 quantified using qPCR, normalized to a housekeeping control gene (GAPDH), and with fold changes measured relative to the isogenic control. qPCR data shows two biological replicates with two technical replicates each. Data is mean + standard deviation.

