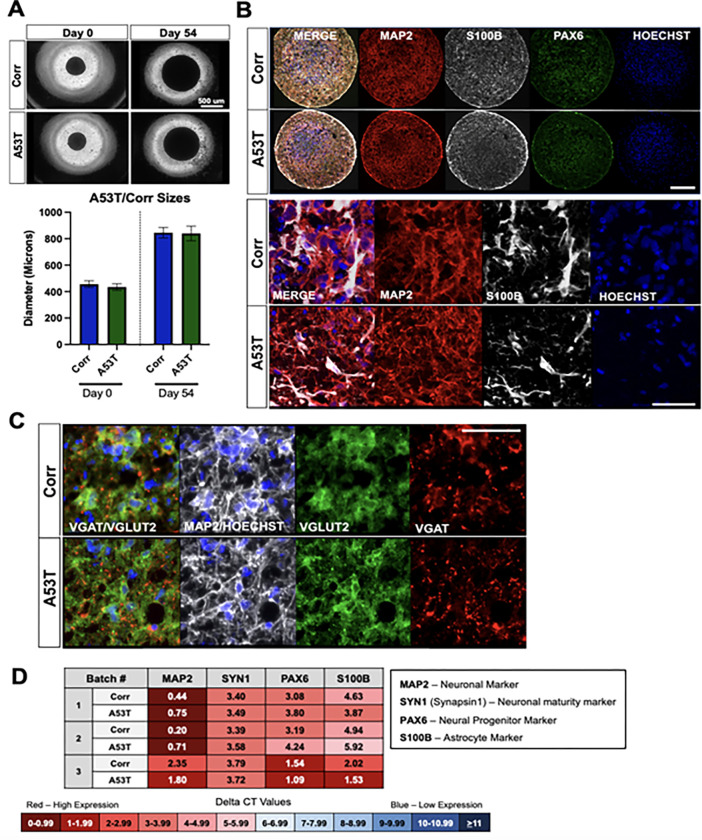
Fig 2. Quality control for A53T/Corr neurosphere differentiations shows cellular subtype composition of cultures.
A) Size difference and variability of neurospheres. Top: Representative phase contrast images of A53T and Corr neurospheres at day 0 and day 54. Bottom: Quantified mean + standard deviation of individual neurospheres across three independent differentiations; n>20 for all groups. B) Immunocytochemistry (ICC) of 54-day-neurospheres for neuronal marker MAP2, astrocyte marker S100B, NSC marker PAX6, and Hoechst. Top panel: Whole sphere view of A53T and Corr spheres. Scale bar: 200 μm. Bottom Panel: Magnified view of MAP2 and S100B positive cells. Scale bar 50 μm. C) ICC of 54-day-neurospheres for MAP2, glutamatergic neuron marker VGLUT2, GABAergic neuron marker VGAT, and Hoechst. Scale bar: 50 μm. D) Gene expression of MAP2, PAX6, S100B, and Synapsin-I in 54-day-neurospheres for three representative neurosphere differentiations. Each differentiation is a pool of 80–90 neurospheres. Delta CT values, measured by qPCR, are the difference between the CT values of the housekeeping gene (GAPDH) and the gene of interest. A lower CT value (in red) indicates high gene expression, while a high CT value (in blue) indicates low gene expression.

