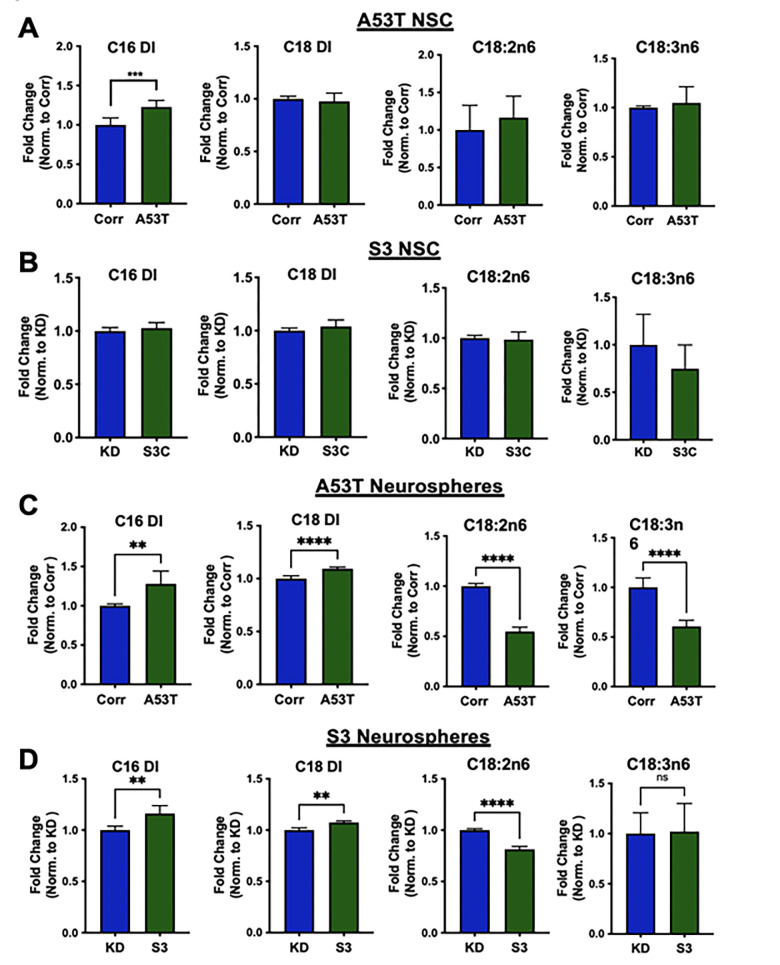
Fig 3. Fatty acid profile of NSC and neurospheres.
Desaturation index (DI) for C16 (C16:1n7/C16:0) and C18 (C18:1n9/C18:0) along with the relative levels of the essential fatty acids, linoleic (C18:2n6) and γ-linolenic acid (C18:3n6), for the A53T/Corr NSC (A) and S3/KD NSC and (B), for the A53T/Corr neurospheres (C) S3/KD neurospheres (D) at day 54. The analysis was conducted using an unpaired two-tailed Student’s t-test, with n = 6 for (A) and n = 5 for (B). The analysis for the neurospheres was conducted using an unpaired t-test, with data from three different neurosphere differentiations. Each differentiation has two biological replicates (total 6 biological replicates). Data is mean + standard deviation and analyzed by a two-tailed Student’s t-test. (*P<0.05; **P<0.01; ***P<0.005; ****P<0.0001).

