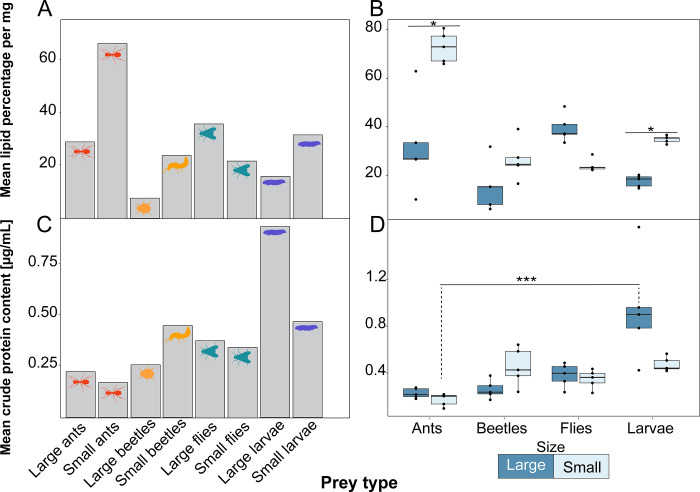
Fig 3. Nutritional content of prey from dietary preference assays.
(A) Average crude lipid contents across replicates of the eight arthropod species are depicted in a bar chart, and (B) Variation of these values across replicates is shown in a box plot, where each dot represents a replicate. (C) Average crude protein content across replicates of the eight arthropod species are depicted in a bar chart, and (D) variation of these values across replicates is shown in a box plot, where each dot represents a replicate.

