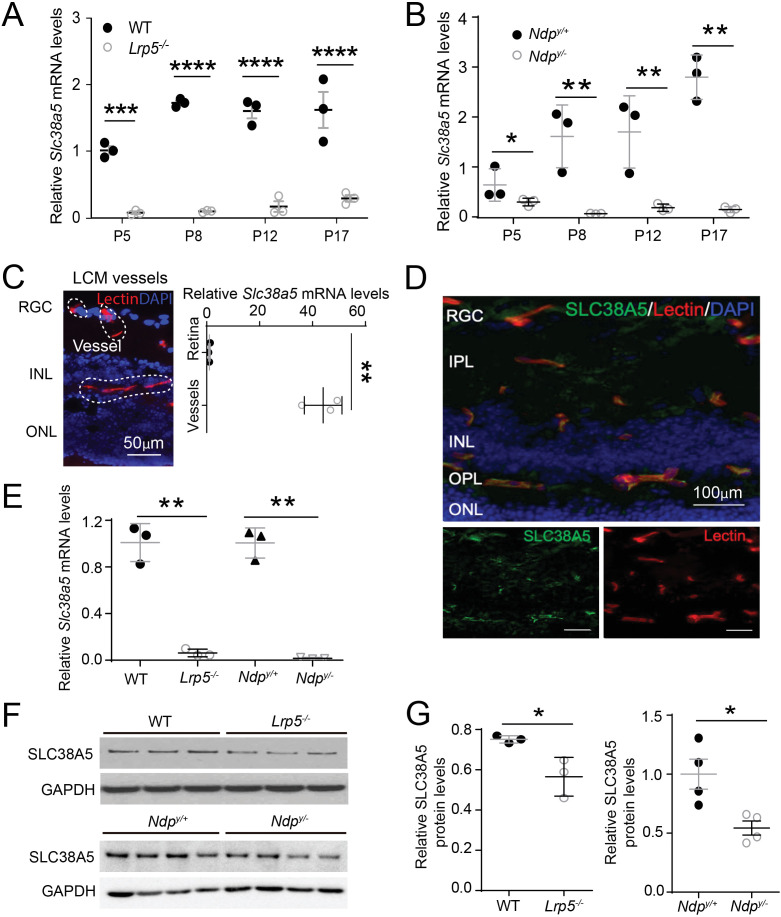
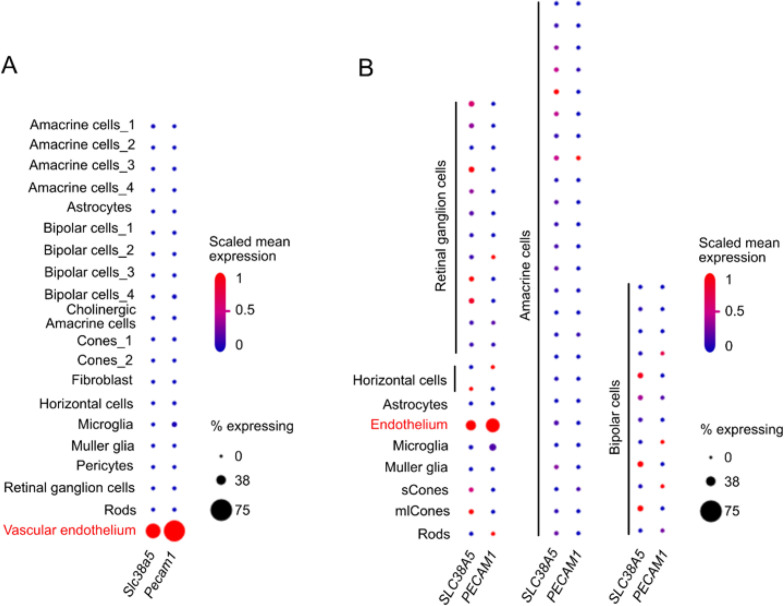
Figure 1. Scl38a5 expression is enriched in retinal blood vessels and down-regulated in the retinas and retinal blood vessels of Wnt signaling deficient Lrp5−/− and Ndpy/− mice.
(A–B) mRNA levels of Slc38a5 were measured by RT-PCR in Lrp5−/− (A) and Ndpy/− (B) retinas compared with their respective wild type (WT) controls during development at postnatal day 5 (P5), P8, P12, and P17. (C) Retinal blood vessels stained with isolectin B4 (red, outlined by the white dashed lines) were isolated by laser-captured microdissection (LCM) from retinal cross-sections. Cell nuclei were stained with DAPI (4′,6-diamidino-2-phenylindole, blue) for illustration purpose only. LCM retinal samples were stained with only isolectin B4 without DAPI. Slc38a5 mRNA levels in LCM isolated retinal blood vessels were compared with the whole retinal levels using RT-qPCR. Scale bars: 50 µm. (D) Immunohistochemistry of retinal cross sections from WT eyes shows colocalization of SLC38A5 antibody (green) in retinal blood vessels stained with isolectin (red), counterstained with nuclear staining DAPI (blue). (E) Slc38a5 mRNA levels in LCM-isolated Lrp5−/− and Ndpy/− retinal blood vessels were quantified with RT-qPCR and compared with their respective WT controls. (F–G) Protein levels of SLC38A5 (52 kDa) in P17 Lrp5−/− and Ndpy/− retinas and their WT controls were quantified with Western blot (F) and normalized by glyceraldehyde-3-phosphate dehydrogenase (GAPDH, 37 kDa) levels (G). RGC: retinal ganglion cells, IPL: inner plexiform layer, INL: inner nuclear layer, OPL: outer plexiform layer, ONL: outer nuclear layer. Data are expressed as mean ± SEM. n=3–4 per group. *p≤0.05, **p≤0.01, ****p≤0.0001.


