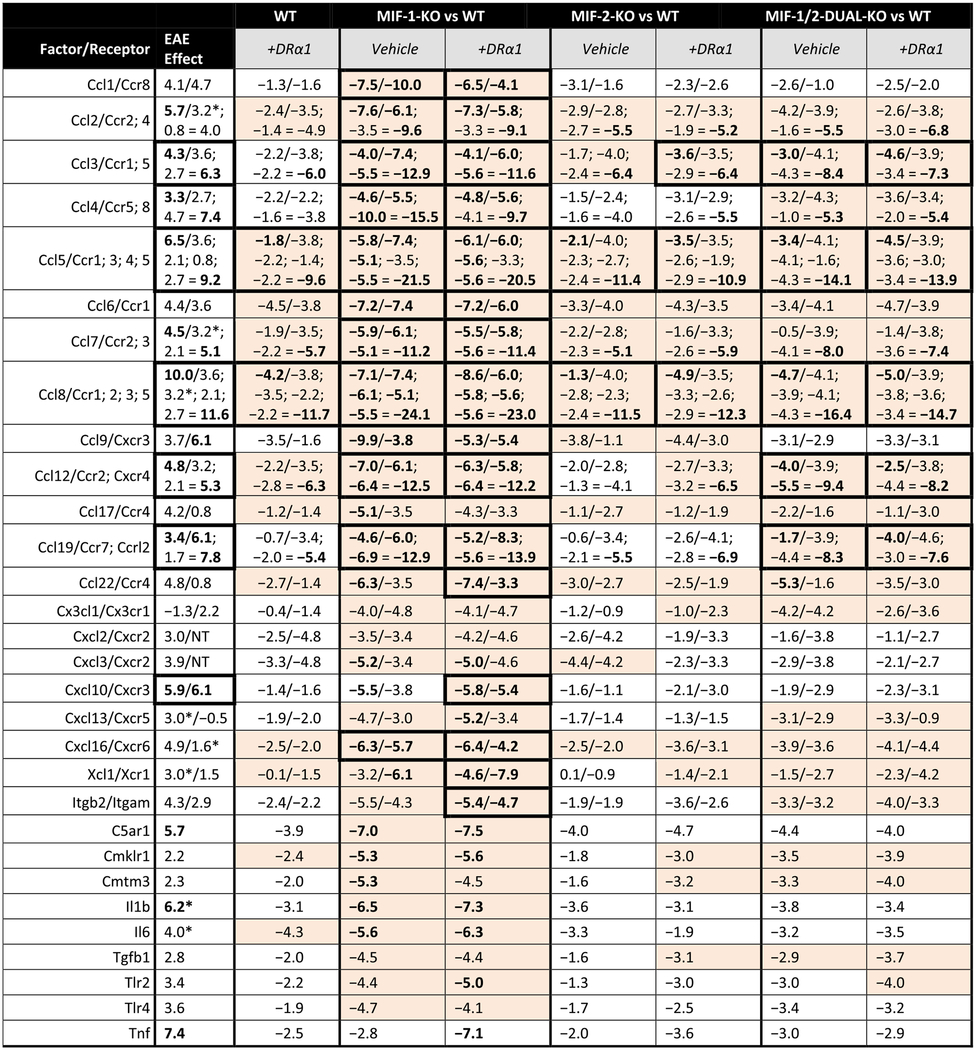
Table 4. EAE effects of chemokines and receptors in males.
EAE effects on chemokines and receptors compared to the corresponding changes in expression for WT and each knockout genotype vs. WT, with and without DRα1-MOG-35-55 treatment, in males. Expression changes are represented by the ΔCT score in log2 units. Effects in bold font are those >5 (log2 units) in magnitude individually or for sums of linked receptors, or >10 summed over matched ligands and receptors (the latter noted by thick borders around the cell). Cells that show complete reversal (to within −0.1) of the EAE and adjuvant effects in either the ligand or matched (sum of) receptors are highlighted.

|
Also contributed to adjuvant effect. NT = Not Tested.
