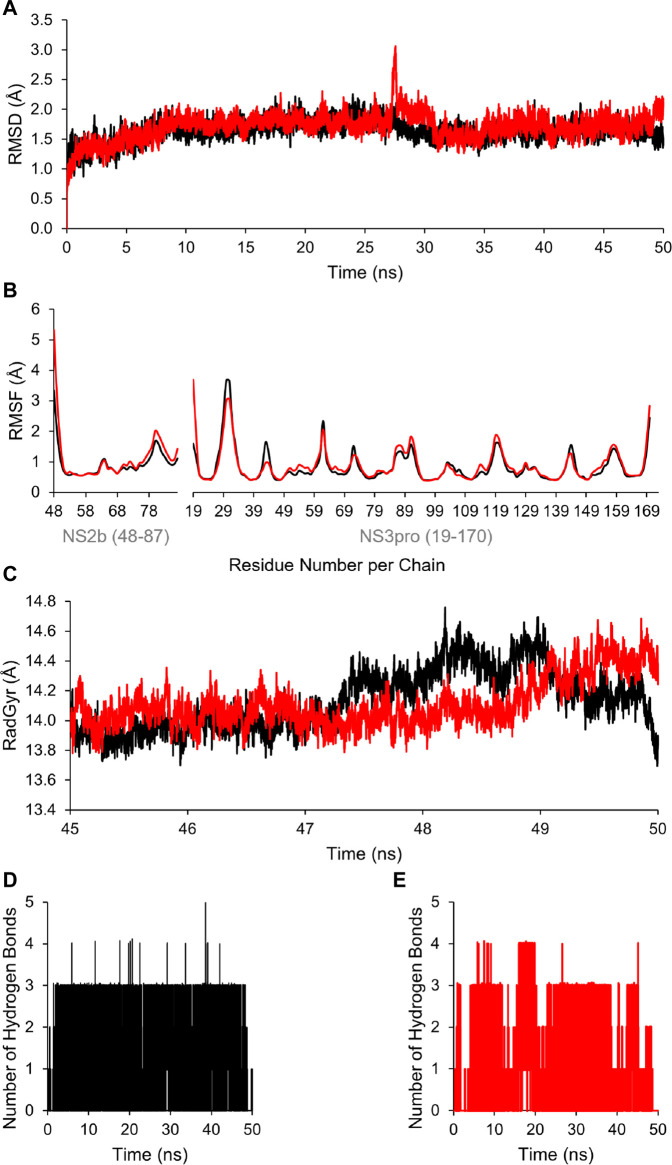
FIGURE 8.
(A) Time evolution for the RMSD of NS2B/NS3 protease in complexes with compounds 4 (black) and 5 (red). (B) RMSF values of NS2B/NS3 protease residues when in complex with compounds 4 (black) and 5 (red). (C) Radius of gyration (RadGyr) of NS2B/NS3 protease in complex with compounds 4 (black) and 5 (red). (D,E) Number of H-bonds formed between the amino acid residues at the catalytic binding site of NS2B/NS3 protease when in complex with compounds 4 (black) and 5 (red), respectively.

