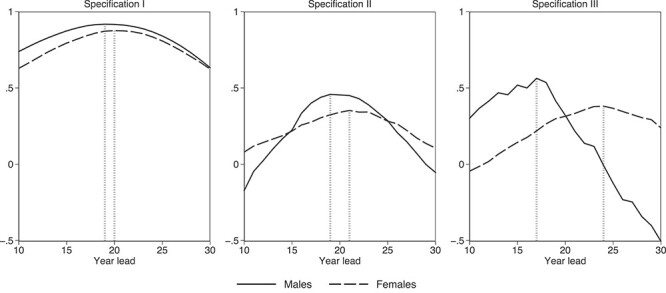
Fig. 3.

Estimated coefficients from regressions of smoking-attributable mortality on smoking prevalence at different temporal distances. Notes: Each point of each line represents a coefficient from a different regression. Observations are at the year-cohort level. Specification I includes no controls; Specification II controls for age and age-squared as well as for GDP (from the Maddison Project Database), health services as a share of GDP and physicians per capita (from the Hellenic Statistical Authority) and population (from the WHO mortality database), all observed at t and t + lead; Specification III controls for birth-cohort, age and year fixed effects. Vertical lines flag maximum estimated coefficients for each gender.
