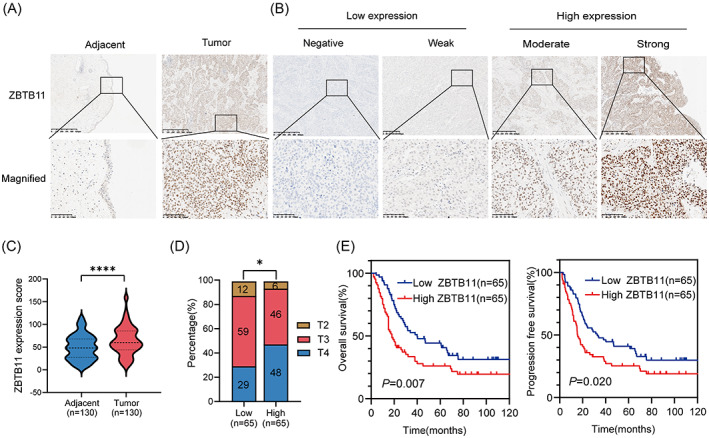
FIGURE 1.

ZBTB11 is upregulated in BC and associated with poor prognosis in patients with BC. (A) Representative immunohistochemical analysis images of ZBTB11 expression in BC tumour and paired adjacent normal tissues. Scale bars: 100 μm. (B) Negative and weak levels of ZBTB11 in BC were considered as low expression; moderate and strong staining intensities were determined as high expression. (C) ZBTB11 expression scores from tumour and paired adjacent normal tissues of BC are presented as a violin plot. Statistical significance was calculated using the two‐tailed Student's t‐test. (D) The percentages of BC tissues from T2 to T4 based on the tumour–node–metastasis staging system with low or high expression of ZBTB11 are presented as a bar chart. Statistical significance was calculated using a chi‐square test to compare percentage of T2–T4 BC samples. (E) Survival curves for patients with BC with high or low expression of ZBTB11. Statistical significance was calculated using Kaplan–Meier analysis and the log‐rank test.
