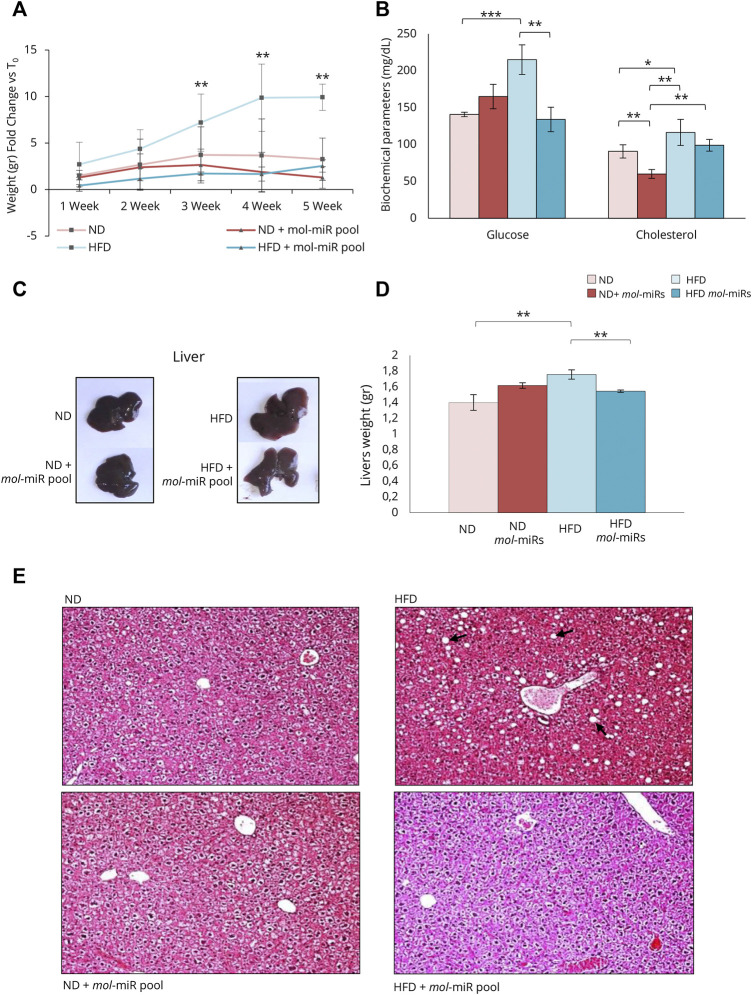
FIGURE 4.
Effect of mol-miR pool in mice after High Fat Diet (HFD). (A) Delta of mouse body weight (grams). The mouse body weight was measured every week from the start of the treatment (T0). (B) Biochemical parameters in mice blood measured after 5 weeks. (C) An overview picture of mice livers. (D) Livers weights (grams). Histograms report the mean ± SD (n = 3 each group, **p < 0.01). Nonparametric one-way ANOVA corrected by the Kruskal-Wallis test was used. (E) Pictures of H&E staining of liver sections of ND or HFD mice supplemented and not with mol-miR pool. The black arrows in the HFD panel, indicate the lipid droplets accumulated in the hepatocytes.

