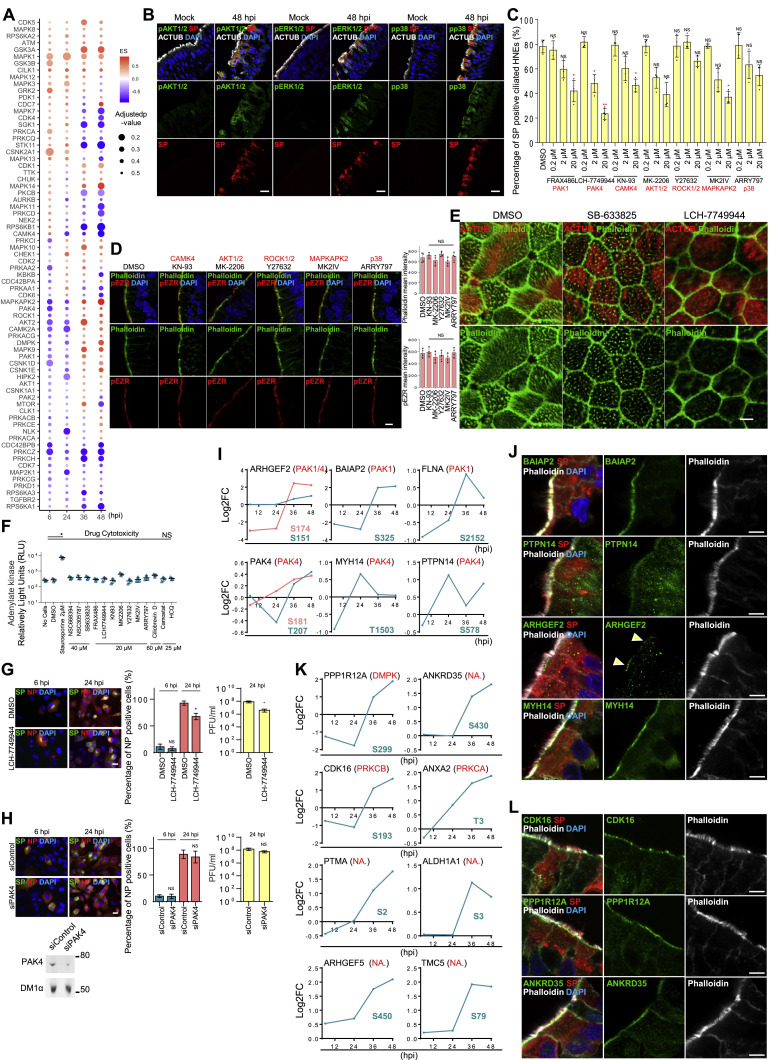
Figure S6.
PAK1/4 regulate microvilli to facilitate the SARS-CoV-2 budding and spreading, related to Figure 6
(A) SARS-CoV-2 infection-affected kinases. ES values of various kinases from KSEA at 6, 24, 36, and 48 hpi after infection. p values were adjusted using Benjamini-Hochberg procedure. 4 biological replicates of phosphopeptide enriched shotgun proteomic samples (Donors 1–4, see Table S1).
(B) SARS-CoV-2 hijack host signaling pathways. SARS-CoV-2-infected HNEs with MOI of 0.3 were stained after 48 hpi. Representative staining of phospho AKT1/2 (pAKT1/2), phospho ERK1/2 (pERK1/2), and phospho p38 (pp38) in combination with ACTUB and SARS-CoV-2 SP in mock-treated and SARS-CoV-2-infected HNEs from Donor 1 is shown. Similar results were observed from Donor 2–4, see Table S1.
(C–E) Identifying kinases involved in both viral infection and microvilli structure. (C) HNEs were treated with either the PAK1 inhibitor FRAX486, the PAK4 inhibitor LCH-7749944, the CAMK4 inhibitor KN-93, the AKT1/2 inhibitor MK-2206, the ROCK1/2 inhibitor Y27632, the MAPKAPK2 inhibitor MK2IV, or the p38 inhibitor ARRY797 prior to SARS-CoV-2 infection and were fixed after 48 hpi. Quantified percentages of SARS-CoV-2 SP positive ciliated HNEs are shown. Error bars represent mean ± SD (3,000–4,000 cells were quantified from DMSO- or drug-treated SARS-CoV-2-infected HNEs from Donor 3–6, see Table S1). (D) Representative IF staining of pEZR and phalloidin in DMSO-, KN-93 (20 uM)-, MK-2206 (20 μM)-, Y27632 (20 uM)-, MK2IV (20 uM)-, and ARRY797 (20 uM)-treated HNEs from Donor 3, see Table S1. Quantification of pEZR and phalloidin from DMSO- or drug-treated HNEs from Donors 5–8 (lower panel; see Table S1) is shown. Error bars represent mean ± SD Drugs were added for 3 h. (E) Representative IF staining of ACTUB and phalloidin in DMSO-, FRAX486- (20 uM)-, and LCH-7749944 (20 uM)-treated HNEs from Donor 6, see Table S1.
(C and D) ∗p < 0.05, ∗∗p < 0.01, ∗∗∗p < 0.001, NS represents not significant, paired, One-way ANOVA with Tukey’s post-test. Each dot represents one donor.
(F) Cytotoxicity measured in companion uninfected cultures. HNEs were exposed to a dose-response of kinase inhibitors, DMSO, or positive control 2 μM staurosporine in triplicate (Donor 4–6). After 48 h, cytotoxicity was measured using Toxilight Assay, which measures adenylate kinase released into the culture medium from dying cells. Staurosporine was significantly different from vehicle and all kinase inhibitors.
(G and H) PAK4 kinases inhibitor as well as siRNA have partial or no significant viral inhibitory effect on ACE2-expressing A549 cells. (G) ACE2-expressing A549 cells were treated with LCH-7749944 (20 uM) for 2 h before SARS-CoV-2 infection with MOI of 0.5 for 24 h. Representative IF staining of SARS-CoV-2 SP and NP staining in DMSO- or drug-treated cells (left panel). Quantified percentages of NP-positive cells (middle panel). Quantitative analysis of viral titer by plaque assay (right panel). (H) siControl- or siPAK4-treated ACE2-expressing A549 cells were infected with SARS-CoV-2 MOI of 0.5 for 24 h. Representative IF staining of SARS-CoV-2 SP and NP staining in siControl- or siPAK4-treated cells (left panel). Quantified percentages of NP-positive cells (middle panel). Quantitative analysis of viral titer by plaque assay (right panel). Immunoblot showing depletion of PAK4 in ACE2-expressing A549 cells (down panel).
(G and H) Error bars represent mean ± SD (2,000–3,000 cells were quantified from drug- or siRNA treated SARS-CoV-2-infected cells. ∗p < 0.05, NS represents not significant, paired, two-tailed Student’s t test.
(I) Log2 fold change profiles of indicated PAK1 and PAK4 potential substrates during infection in HNEs at 48 hpi.
(J) Infected HNEs with MOI of 0.3 were stained at 48 hpi. Representative IF staining of BAIAP2, PTPN14, ARHGEF2, or MYH14 with ACTUB and SP in infected HNEs from Donor 1. Similar results were observed from Donors 2–4, see Table S1.
(K) Log2 fold change profiles of filopodia- and cytoskeleton-related proteins during SARS-CoV-2 infection in HNEs after 48hpi.
(L) SARS-CoV-2-infected HNEs with MOI of 0.3 were stained after 48 hpi. Shown here are representative IF images of CDK16, PPP1R12A, and ANKRD35 in combination with ACTUB and SARS-CoV-2 SP in SARS-CoV-2-infected HNEs from Donor 1. Similar results were observed from Donor 2–4, see Table S1. Scale bars represent 5 μm (A, D, E, G, H, J, and L) and 20 μm (B).

