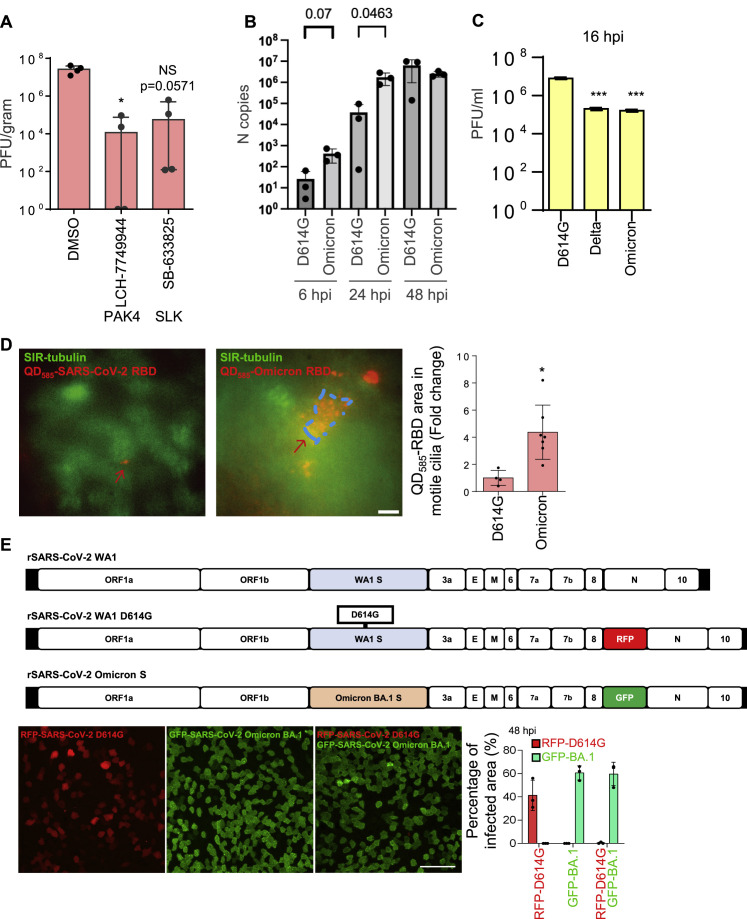
Figure S7.
Higher viral entry and replication of Omicron in human nasal epithelium, related to Figure 7
(A) The effect of microvilli inhibitors in the mouse models. K18-hACE2 mice were infected with SARS-CoV-2 (1000 PFU) intranasally with the inhibitors or vehicle control (solvent) at day 0. Then the inhibitors were delivered intranasally once per day at day 0 and 1. At day 3 (i.e., 3 dpi), the lung were harvested for analysis. Virus titer measurement using plaque assay for the lung. The number of mice is 4 (n = 4) per group. SB-633825 and LCH-7749944 were used as 10 mg/mouse by intranasal inoculation. Data are shown as mean ± SD Kolmogorov-Smirnov test, ∗P < 0.05. The same experiment was repeated 3 times and similar results were obtained.
(B) SARS-CoV-2 D614G and Omicron variants replication kinetics in HNEs. qPCR data were collected with the use of the infected cells derived from Donor 6–8, see Table S1.
(C) Quantitative analysis of viral titer from plaque assays on different strains of SARS-Co-V2-infected Vero E6 cells. ∗∗∗p < 0.001, paired, two-tailed Student’s t test.
(D) Omicron’s RBD has a stronger cilia adhesion ability. ALI-cultured HNEs were labeled by SiR-tubulin and treated with pseudovirion, quantum dot-conjugated SARS-CoV-2 D614G (left image, QD585-SARS-CoV-2 RBD), or Omicron receptor binding domain (right image, QD585-Omicron RBD) for 6 h. Quantification of the intensity of pseudovirion of ciliated HNEs was performed on the right panel. Error bars represent mean ± SD (5–10 cells were quantified from HNEs from Donor 6–8, see Table S1).
(E) Compared to D614G, Omicron has a stronger infectivity. D614G-RFP (MOI 2) or D614G -SpikeOmicron-BA.1-GFP (MOI 0.1) or double-infected (same MOIs) infected HNEs were stained at 48 hpi. Representative IF images of RFP or GFP in HNEs from Donor 6. Quantified percentages of RFP- or GFP-positive area (right panel). Error bars represent mean ± SD (data were collected from Donors 6–8, see Table S1). Scale bars represent 10 μm (D) and 50 μm (E).

