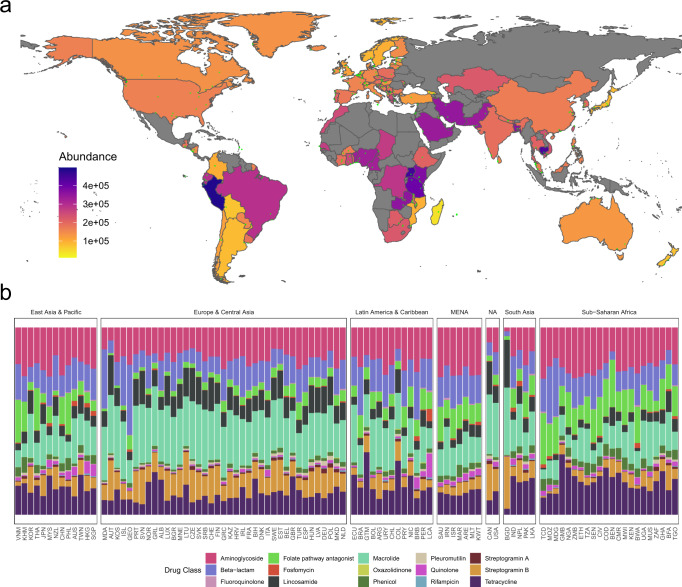
Fig. 1. The global resistome based on sewage-based monitoring.
a Choropleth of the world coloured by the country-wise average total AMR load (see methods). Small green dots show unique sampling sites contributing to the average. Some areas are disputed, and we realize that exact border placement is difficult due to geopolitical issues. b Stacked bar chart of relative abundances per drug class per country. Each panel represent countries in a World Bank region and is ordered by the Shannon diversity of class-level AMR.

