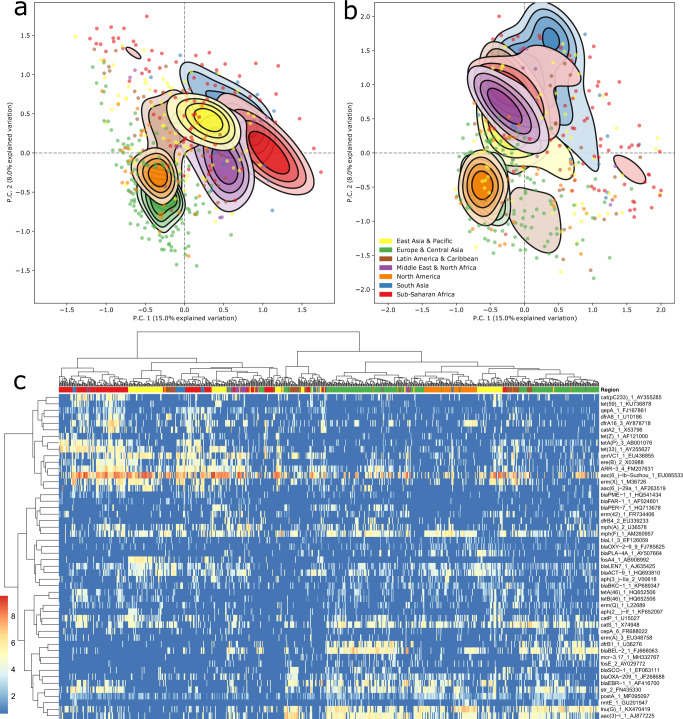
Fig. 2. World regional effects of both bacteriomes and resistomes.
a Resistance gene (90% homology grouping) PCA clustering. b Bacterial genus PCA clustering. The principal components in both panels are calculated from centered log-ratio (CLR) transformed size-adjusted counts. The contours show the group-wise sample density and are truncated at 50% of the peak value. Samples outside this range are drawn as individual points. c Clustered resistome heatmap showing the additive log ratio (ALR) abundance of the 50 most variable ARGs in the dataset. Hierarchical clustering of sample columns is based on all ARGs, not just the visualized ones. The darkest blue indicates no assigned reads in sample-ARG combination.

