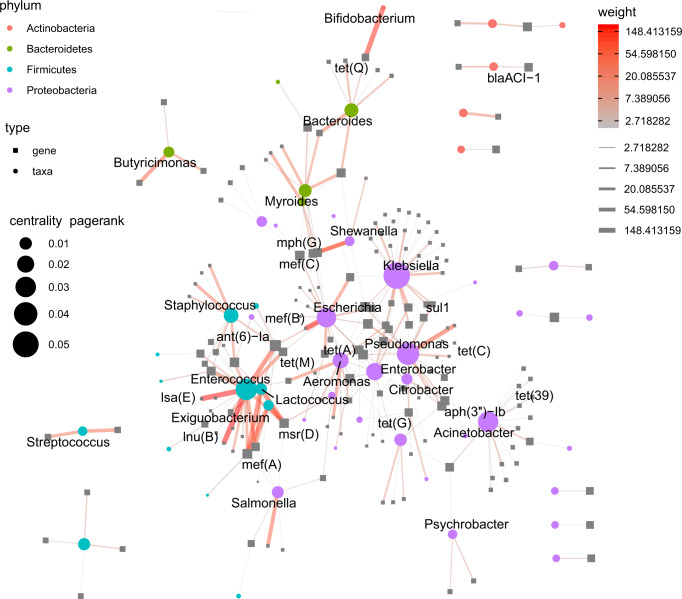
Fig. 4. Gene-sharing network between bacterial genera.
Edges link ARGs to the genera which their contigs were taxonomically assigned to. Only flanked, non-plasmidic contigs were used. The backbone algorithm was used to compute the graph layout. Color and thickness of edges denote the number of observed taxa-gene co-occurrences. Nodes are ARGs and genera which are visualized as grey boxes and colored circles respectively. Node size denote the centrality of the individual nodes to the overall network. Smaller subgraphs were manually moved for space efficiency, so relative distances between those mean nothing.

