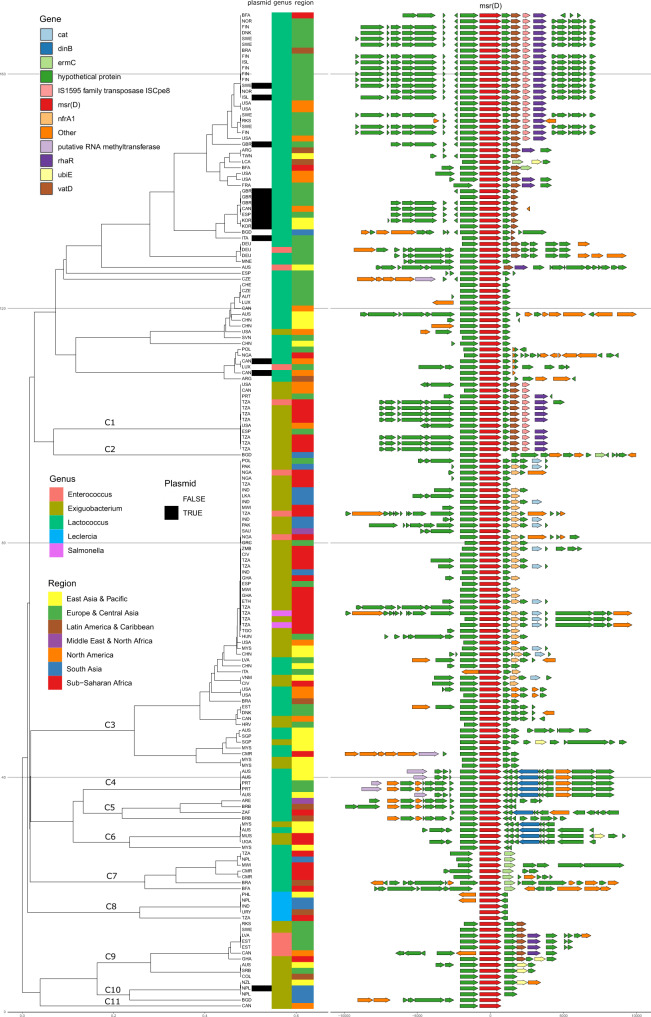
Fig. 5. ARG Flanks show diverse genomic contexts.
Flanking sequence for msr(D) variants in the sewage were used to calculate a kmer distance UPGMA tree. The tree shows contig-level annotation: plasmid annotation status, predicted genera and World Bank region. For ARG synteny analyses, all variants of the ARG were oriented and centered, with up- and down-stream predicted features drawn in. A subset of clusters is labelled to allow referencing. All common ARGs are clustered like this according to flank and gene (Supplementary Data 3 and 4) and so is the subset with 5Kb flanks (Supplementary Data 5 and 6).

