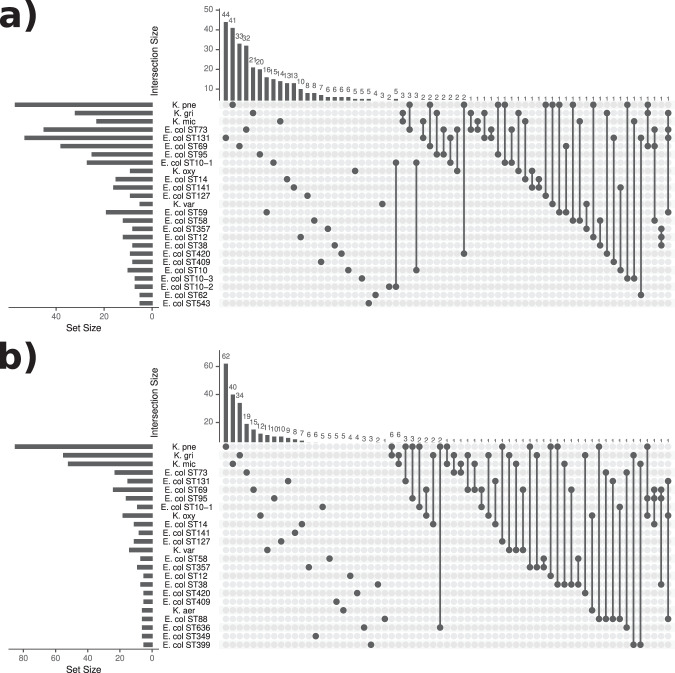
Fig. 3. UpSet plot showing coexistence of E. coli lineages with Klebsiella species.
The plot displays the number of times the E. coli lineages and various Klebsiella species were found either alone (single dots) or together in a sample (connected dots), and at least five times. Data are shown in (a) for the vaginal delivery cohort, and in (b) for the caesarean section delivery cohort. Set size (bottom-left subpanels) refers to the number of times a taxonomic unit was found in total, while intersection size (top subpanels) refers to the number of times a taxonomic unit was found alone or coexisting with other unit(s).

