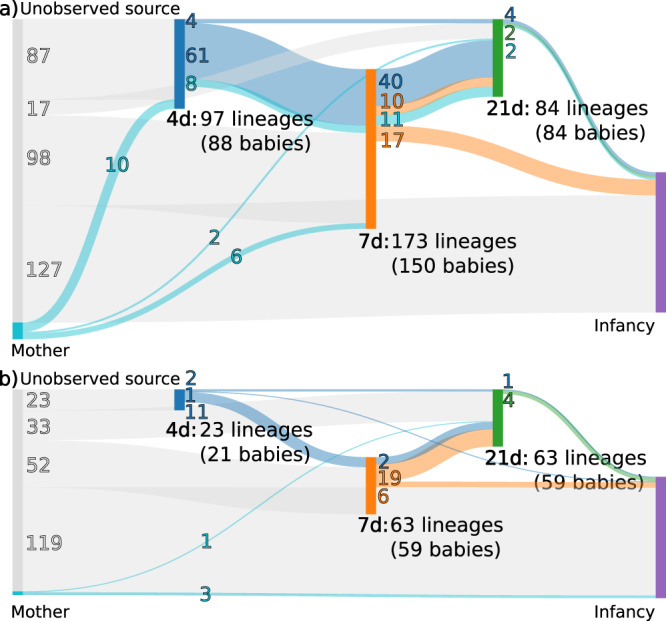
Fig. 4. Summary figure of E. coli gut colonisation.

The plot displays the numbers of E. coli lineages found at each of the five major sampling points (4, 7, and 21 days after birth, in the infancy period, and from the mothers in the maternity unit). The flows indicate the (possible) numbers of lineages that were transmitted between the sampling points, with the colours corresponding to the first time point the transmitted lineages were detected in. Flows that skip a sampling point (such as from 4 days to 21 days) indicate that a lineage returned to detectable levels after the skipped sampling point. a Displays the vaginal delivery cohort, and b the caesarean section cohort.
