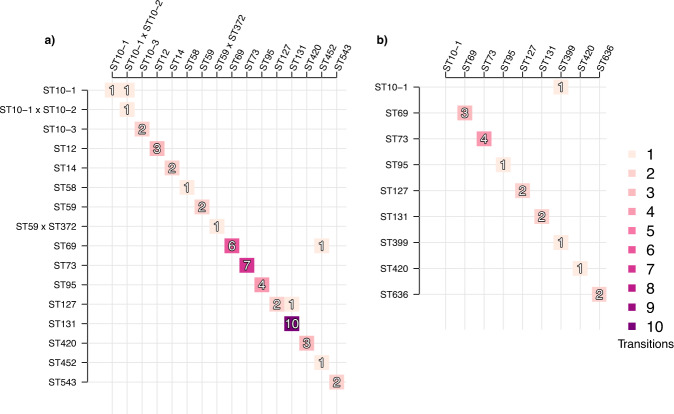
Fig. 5. Event matrix displaying colonisation identities with respect to E. coli lineages between subsequent time points.
The figure shows events corresponding to either transition from one E. coli lineage (rows) to another E. coli lineage (columns) or persistence of the same lineage (diagonal). a Events for the vaginal delivery cohort with samples from the infancy period excluded, and b Events for the caesarean section delivery cohort with infancy period excluded. Darker shades of purple denote more common events, the count of which is also indicated by the number contained within the shaded boxes. Lineages shown were observed at least twice across the whole set of samples.

