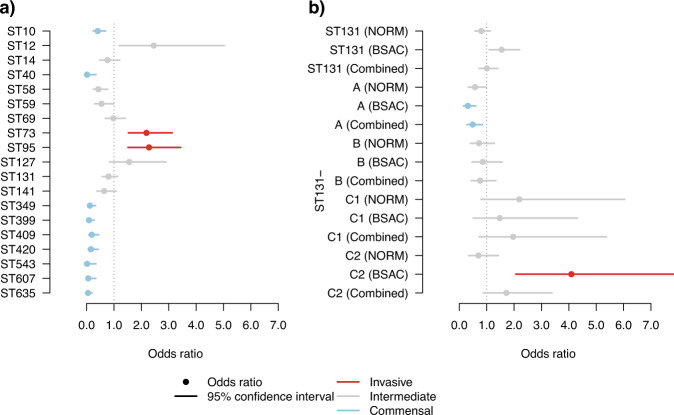
Fig. 6. Odds ratios for relative E. coli invasiveness.
The odds ratios (OR) for invasiveness are displayed with the 95% confidence interval centred on the OR. The confidence intervals with a statistically significant (p < 0.05, two-tailed Pearson’s chi-squared test with Benjamini-Hochberg adjustment for multiple testing) lower bounds greater than 1 correspond to more invasive lineages (coloured red; OR statistically significantly higher than 1), and confidence intervals with a statistically significant upper bound <1 to more commensal lineages (coloured light blue; OR statistically significantly <1). Lineages with a confidence interval that contains the value 1, or are not statistically significantly different from 1, are labelled as intermediate (coloured grey). The confidence intervals are shown in (a) for both the top 10 most frequent lineages in Norwegian (NORM) bloodstream infections (STs 10, 12, 14, 59, 69, 73, 95, 127, 131, and 141) and all additional lineages, where the OR was estimated to differ from 1 (significantly or not). b The confidence intervals estimated for both ST131 as a whole and additionally for its established sublineages (ST131 A, B, C1, and C2). For both ST131 and the subclades, the estimates are reported using either the BSAC (UK) collection, the NORM (Norway) collection, or combined collections for comparison. The exact p-values and the sample sizes are available in the Source Data file for this figure.

