Figure 1.

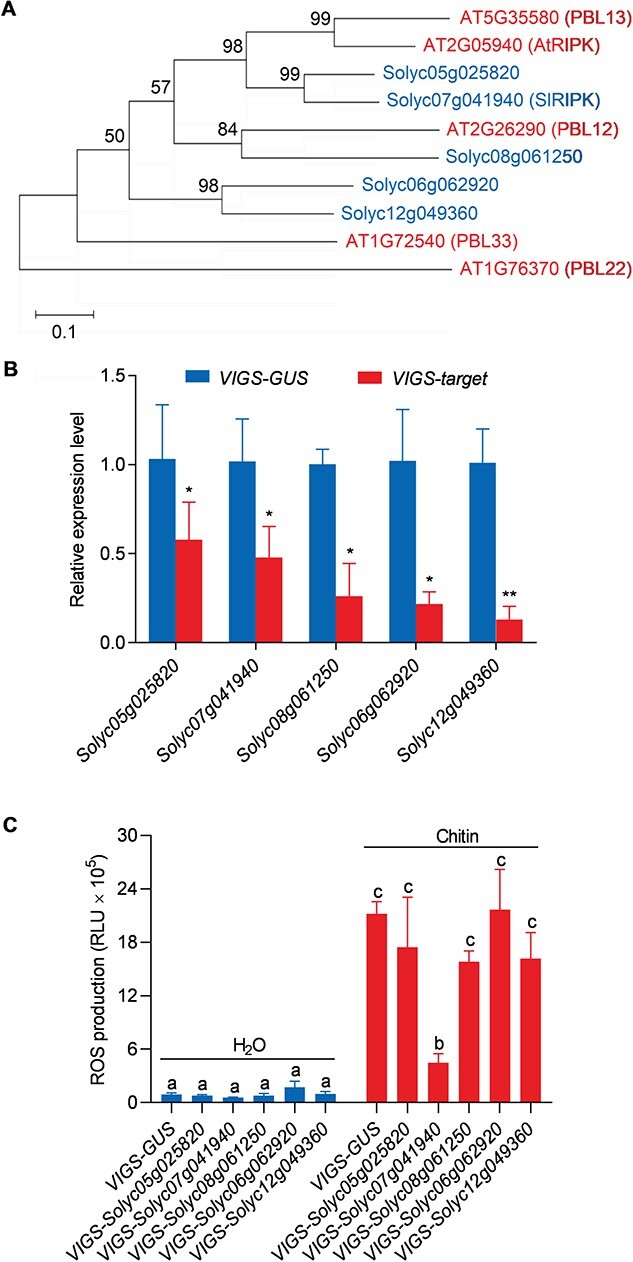
Chitin-induced ROS production in tomato leaves was reduced after silencing Solyc07g041940 gene. A Phylogenetic tree of RIPK subgroups in Arabidopsis thaliana (AT) and Solanum lycopersicum (Solyc). A phylogenetic tree containing all PBL proteins is shown in Figure S1 (see online supplementary material). The phylogenetic tree was constructed using the maximum-likelihood method. The branches are labeled with their respective bootstrap values. Red represents A. thaliana and blue represents S. lycopersicum. B Silencing efficiency: Solyc05g025820, Solyc06g062920, Solyc07g041940, Solyc08g061250, and Solyc12g049360 were silenced using virus-induced gene silencing (VIGS). The relative transcript levels of these genes in the leaves were determined using qRT-PCR analysis four weeks after infiltration with Agrobacterium tumefaciens carrying its cognate VIGS constructs, and VIGS-GUS was used as a negative control. Data are shown as the mean ± SD (n = 3). Asterisks indicate significant differences compared with the VIGS-GUS control (*P ≤ 0.05, **P ≤ 0.01, t-test). C Chitin induced ROS production in tomato leaves after silencing the indicated genes. ROS levels were measured using a luminol-based chemiluminescent assay after treatment with chitin (20 μg/mL). Total ROS production within 30 min is shown. Data are shown as the mean ± SD (n = 8). Different letters above the bars indicate significant differences between the different genotypes (P ≤ 0.05, one-way ANOVA).
